

Actual patterns

Patterns are graphical models which are formed in the chart by the price. According to one of the technical analysis postulates, history (price movement) repeats itself. It means that the price movements are often similar in the same situations which makes it possible to predict the further development of the situation with a high probability.
Relevant patterns by InstaTrade is an easy-to-use service which allows you to be aware of latest changes in the market and react to clues from the market in time. In our service you will always find the latest and most relevant patterns on any pair and any timeframe.
Triple Top
was formed on 02.04 at 14:15:10 (UTC+0)
signal strength 1 of 5
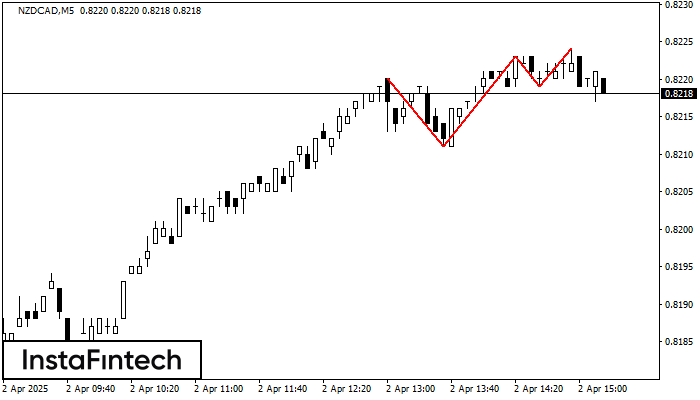
The Triple Top pattern has formed on the chart of the NZDCAD M5 trading instrument. It is a reversal pattern featuring the following characteristics: resistance level -4, support level -8, and pattern’s width 9. Forecast If the price breaks through the support level 0.8211, it is likely to move further down to 0.8208.
The M5 and M15 time frames may have more false entry points.
See Also
- All
- All
- Bearish Rectangle
- Bearish Symmetrical Triangle
- Bearish Symmetrical Triangle
- Bullish Rectangle
- Double Top
- Double Top
- Triple Bottom
- Triple Bottom
- Triple Top
- Triple Top
- All
- All
- Buy
- Sale
- All
- 1
- 2
- 3
- 4
- 5
Cabeza y Hombros
was formed on 01.05 at 11:05:37 (UTC+0)
signal strength 1 of 5
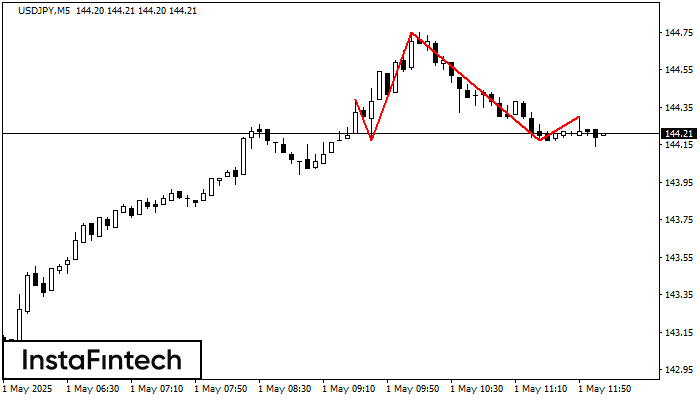
Según el gráfico de M5, USDJPY formó el patrón. El techo de la Cabeza está establecido en 144.75 mientras la línea media del Cuello se encuentra en 144.17/144.17. La formación
Los marcos de tiempo M5 y M15 pueden tener más puntos de entrada falsos.
Open chart in a new window
Doble Piso
was formed on 01.05 at 11:00:18 (UTC+0)
signal strength 1 of 5
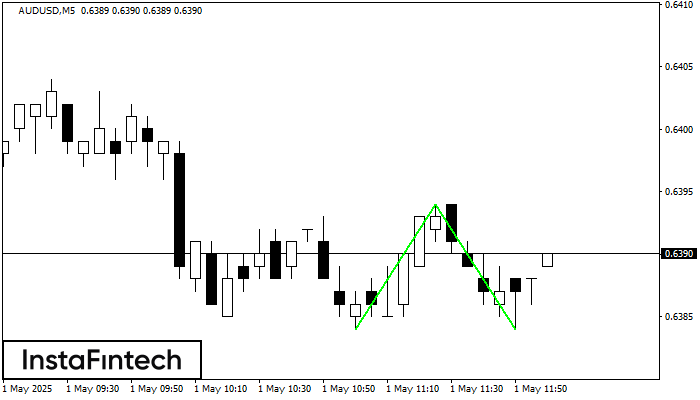
El patrón Doble Piso ha sido formado en AUDUSD M5; el límite superior es 0.6394; el límite inferior es 0.6384. El ancho del patrón es 10 puntos. En caso
Los marcos de tiempo M5 y M15 pueden tener más puntos de entrada falsos.
Open chart in a new window
Doble Techo
was formed on 01.05 at 11:00:08 (UTC+0)
signal strength 1 of 5
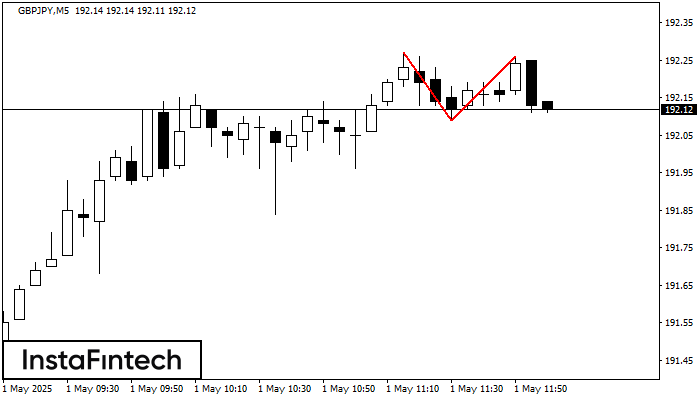
En el gráfico de GBPJPY M5 el patrón de reversión Doble Techo ha sido formado. Características: límite superior 192.26; límite inferior 192.09; el ancho del patrón 17 puntos. La señal
Los marcos de tiempo M5 y M15 pueden tener más puntos de entrada falsos.
Open chart in a new window


