

Actual patterns

Patterns are graphical models which are formed in the chart by the price. According to one of the technical analysis postulates, history (price movement) repeats itself. It means that the price movements are often similar in the same situations which makes it possible to predict the further development of the situation with a high probability.
Relevant patterns by InstaTrade is an easy-to-use service which allows you to be aware of latest changes in the market and react to clues from the market in time. In our service you will always find the latest and most relevant patterns on any pair and any timeframe.
Actual Patterns
- All
- All
- Bearish Rectangle
- Bearish Symmetrical Triangle
- Bearish Symmetrical Triangle
- Bullish Rectangle
- Double Top
- Double Top
- Triple Bottom
- Triple Bottom
- Triple Top
- Triple Top
- All
- All
- Buy
- Sale
- All
- 1
- 2
- 3
- 4
- 5
Double Top
was formed on 30.04 at 17:55:22 (UTC+0)
signal strength 1 of 5
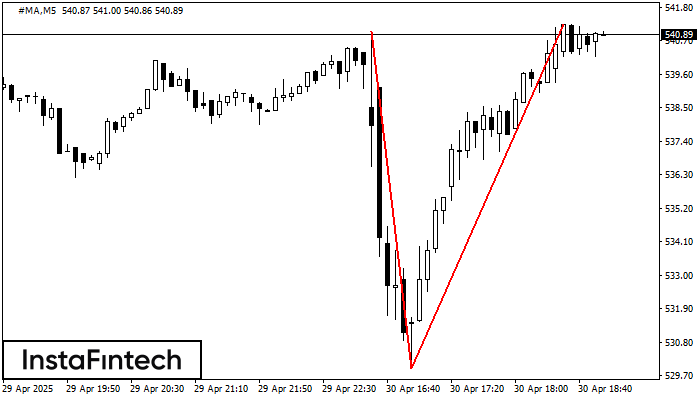
On the chart of #MA M5 the Double Top reversal pattern has been formed. Characteristics: the upper boundary 541.24; the lower boundary 529.93; the width of the pattern 1131 points
The M5 and M15 time frames may have more false entry points.
Open chart in a new window
Bearish pennant
was formed on 30.04 at 16:35:46 (UTC+0)
signal strength 2 of 5
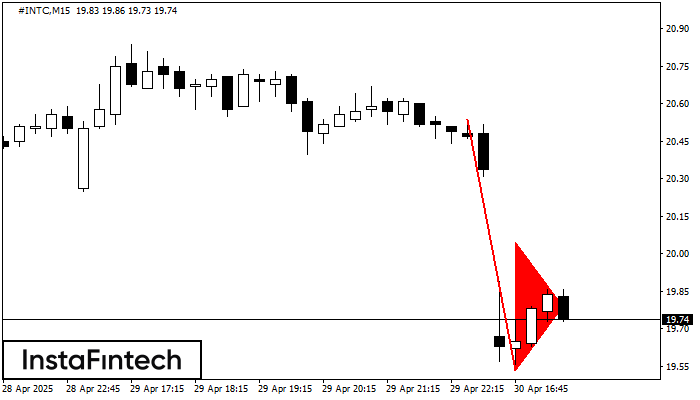
The Bearish pennant pattern has formed on the #INTC M15 chart. The pattern signals continuation of the downtrend in case the pennant’s low of 19.53 is broken through. Recommendations: Place
The M5 and M15 time frames may have more false entry points.
Open chart in a new window
Bearish Rectangle
was formed on 30.04 at 16:31:32 (UTC+0)
signal strength 3 of 5
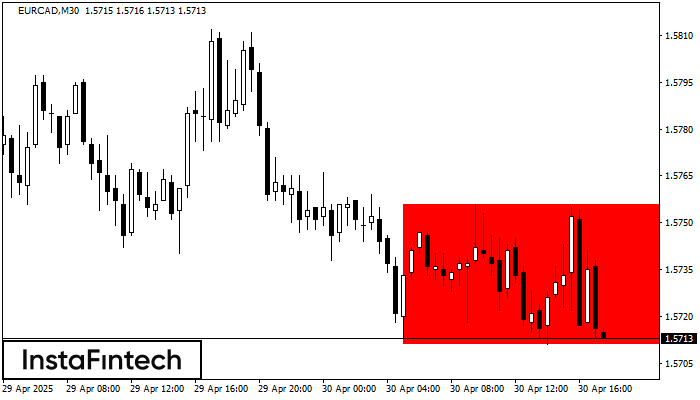
According to the chart of M30, EURCAD formed the Bearish Rectangle which is a pattern of a trend continuation. The pattern is contained within the following borders: lower border 1.5711
Open chart in a new window
Triple Top
was formed on 30.04 at 16:30:26 (UTC+0)
signal strength 4 of 5
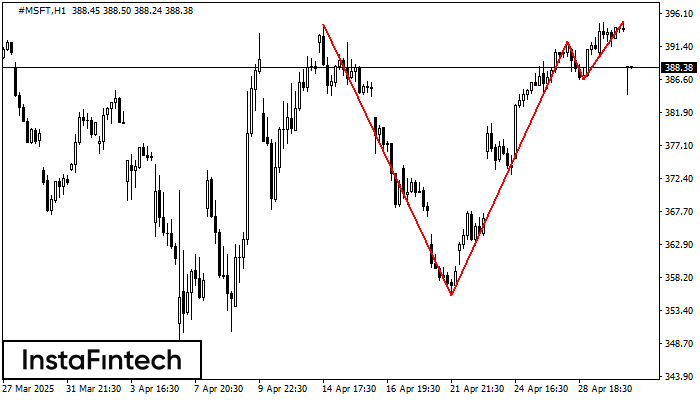
The Triple Top pattern has formed on the chart of the #MSFT H1 trading instrument. It is a reversal pattern featuring the following characteristics: resistance level -35, support level -3099
Open chart in a new window
Bearish Symmetrical Triangle
was formed on 30.04 at 15:41:07 (UTC+0)
signal strength 5 of 5
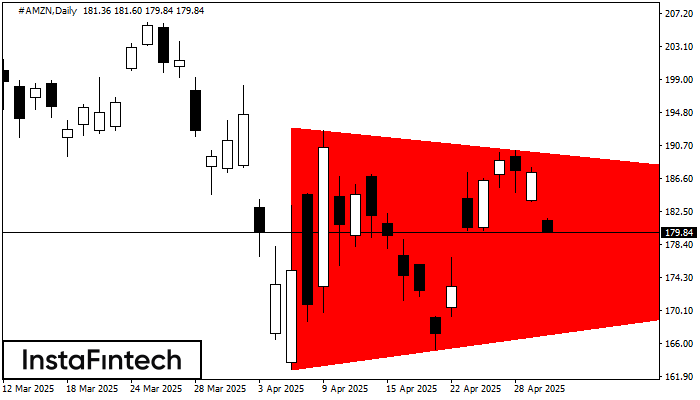
According to the chart of D1, #AMZN formed the Bearish Symmetrical Triangle pattern. This pattern signals a further downward trend in case the lower border 162.77 is breached. Here
Open chart in a new window
Double Top
was formed on 30.04 at 15:30:25 (UTC+0)
signal strength 3 of 5
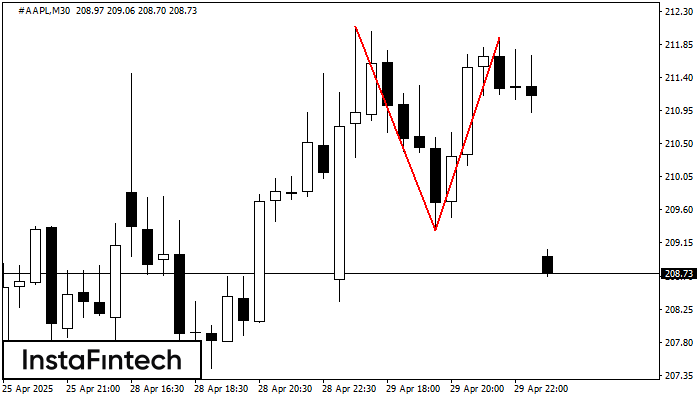
The Double Top pattern has been formed on #AAPL M30. It signals that the trend has been changed from upwards to downwards. Probably, if the base of the pattern 209.32
Open chart in a new window
Double Top
was formed on 30.04 at 15:30:24 (UTC+0)
signal strength 4 of 5
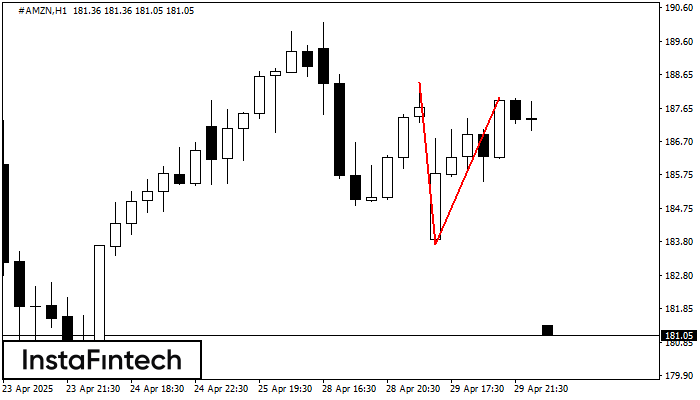
The Double Top reversal pattern has been formed on #AMZN H1. Characteristics: the upper boundary 188.42; the lower boundary 183.71; the width of the pattern is 426 points. Sell trades
Open chart in a new window
Double Bottom
was formed on 30.04 at 15:00:30 (UTC+0)
signal strength 3 of 5
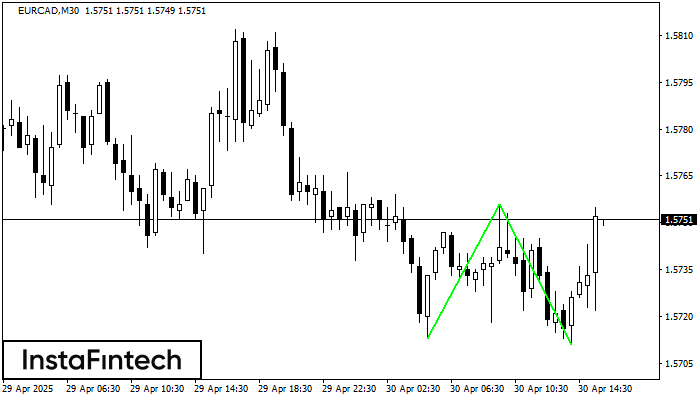
The Double Bottom pattern has been formed on EURCAD M30. This formation signals a reversal of the trend from downwards to upwards. The signal is that a buy trade should
Open chart in a new window
Double Bottom
was formed on 30.04 at 15:00:21 (UTC+0)
signal strength 4 of 5
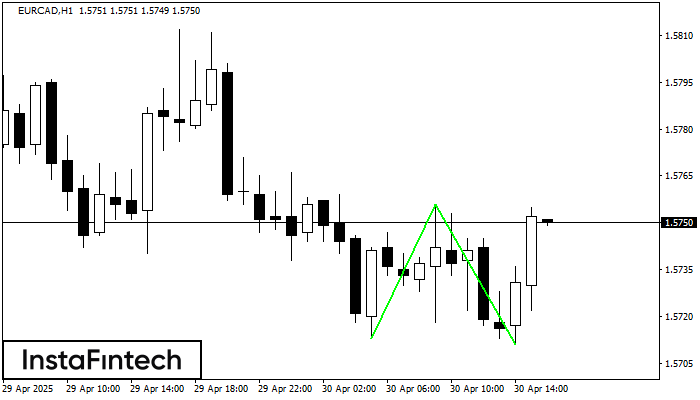
The Double Bottom pattern has been formed on EURCAD H1. Characteristics: the support level 1.5713; the resistance level 1.5756; the width of the pattern 43 points. If the resistance level
Open chart in a new window


