

Долзарб паттернлар

Медвежий флаг
сформирован 21.04 в 03:54:43 (UTC+0)
сила сигнала 2 из 5

На графике AUDJPY M15 сформировалась фигура «Медвежий флаг», которая сигнализирует о продолжении нисходящего тренда. В случае, если цена зафиксируется ниже минимума фигуры 90.01, движение вниз, скорее всего, продолжится. Перспективой будущего движения будет являться проекция высоты флагштока (15 пунктов).
Таймфреймы М5 и М15 могут иметь больше ложных точек входа.
- Все
- Все
- Bearish Rectangle
- Bearish Symmetrical Triangle
- Bearish Symmetrical Triangle
- Bullish Rectangle
- Double Top
- Double Top
- Triple Bottom
- Triple Bottom
- Triple Top
- Triple Top
- Все
- Все
- Покупка
- Продажа
- Все
- 1
- 2
- 3
- 4
- 5
Inverse Head and Shoulder
was formed on 01.05 at 08:45:27 (UTC+0)
signal strength 1 of 5
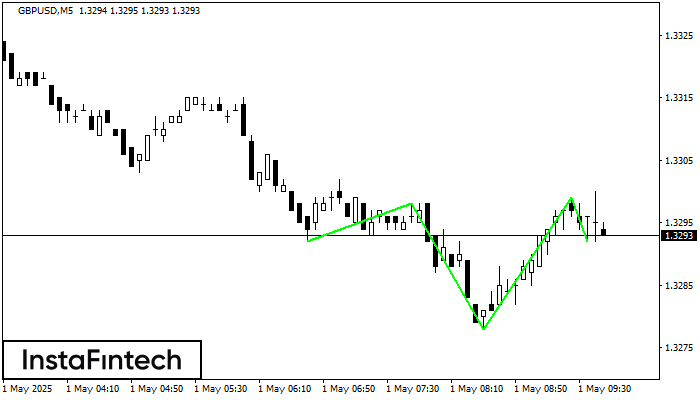
According to the chart of M5, GBPUSD formed the Inverse Head and Shoulder pattern. The Head’s top is set at 1.3299 while the median line of the Neck is found
The M5 and M15 time frames may have more false entry points.
Open chart in a new window
Double Bottom
was formed on 01.05 at 08:10:21 (UTC+0)
signal strength 1 of 5
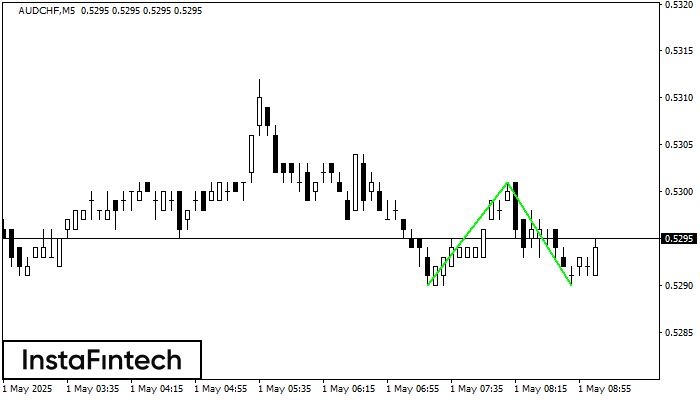
The Double Bottom pattern has been formed on AUDCHF M5. Characteristics: the support level 0.5290; the resistance level 0.5301; the width of the pattern 11 points. If the resistance level
The M5 and M15 time frames may have more false entry points.
Open chart in a new window
Double Bottom
was formed on 01.05 at 08:05:08 (UTC+0)
signal strength 1 of 5
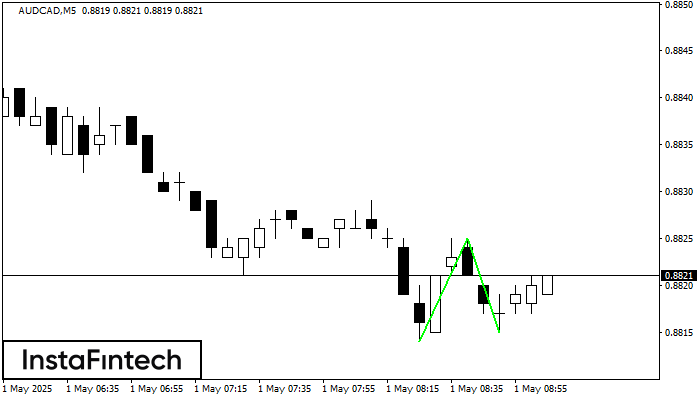
The Double Bottom pattern has been formed on AUDCAD M5. Characteristics: the support level 0.8814; the resistance level 0.8825; the width of the pattern 11 points. If the resistance level
The M5 and M15 time frames may have more false entry points.
Open chart in a new window


