

Долзарб паттернлар

Двойное дно
сформирован 16.04 в 08:35:10 (UTC+0)
сила сигнала 1 из 5
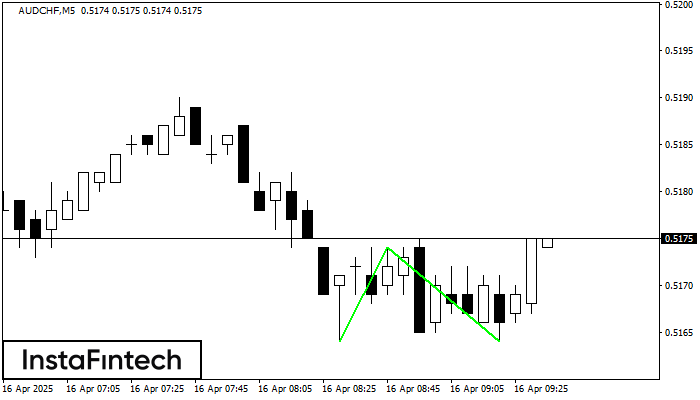
Сформирована фигура «Двойное дно» на графике AUDCHF M5. Характеристика: Уровень поддержки 0.5164; Уровень сопротивления 0.5174; Ширина фигуры 10 пунктов. В случае пробоя уровня сопротивления можно будет прогнозировать изменение тенденции, где первая точка фиксации прибыли находится на расстоянии 10 пунктов.
Таймфреймы М5 и М15 могут иметь больше ложных точек входа.
- Все
- Все
- Bearish Rectangle
- Bearish Symmetrical Triangle
- Bearish Symmetrical Triangle
- Bullish Rectangle
- Double Top
- Double Top
- Triple Bottom
- Triple Bottom
- Triple Top
- Triple Top
- Все
- Все
- Покупка
- Продажа
- Все
- 1
- 2
- 3
- 4
- 5
Bearish Rectangle
was formed on 04.05 at 00:51:55 (UTC+0)
signal strength 3 of 5

According to the chart of M30, #Bitcoin formed the Bearish Rectangle. This type of a pattern indicates a trend continuation. It consists of two levels: resistance 96456.78 - 0.00
Open chart in a new window
Double Bottom
was formed on 03.05 at 10:45:44 (UTC+0)
signal strength 2 of 5

The Double Bottom pattern has been formed on #Bitcoin M15. This formation signals a reversal of the trend from downwards to upwards. The signal is that a buy trade should
The M5 and M15 time frames may have more false entry points.
Open chart in a new window
Double Bottom
was formed on 03.05 at 08:00:01 (UTC+0)
signal strength 3 of 5

The Double Bottom pattern has been formed on #Bitcoin M30; the upper boundary is 97860.25; the lower boundary is 96258.44. The width of the pattern is 156618 points. In case
Open chart in a new window


