

Долзарб паттернлар

Медвежий симметричный треугольник
сформирован 15.04 в 20:14:46 (UTC+0)
сила сигнала 1 из 5
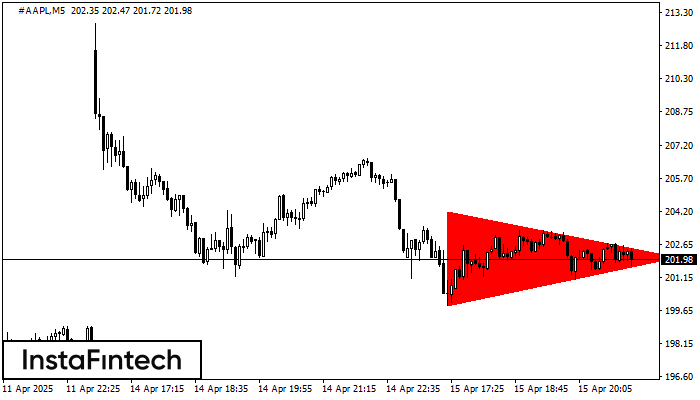
На графике #AAPL на M5 сформировалась фигура «Медвежий симметричный треугольник». Торговые рекомендации: Пробой нижней границы 199.85 с большой долей вероятности приведет к продолжению нисходящего тренда.
Таймфреймы М5 и М15 могут иметь больше ложных точек входа.
Шунингдек кўринг
- Все
- Все
- Bearish Rectangle
- Bearish Symmetrical Triangle
- Bearish Symmetrical Triangle
- Bullish Rectangle
- Double Top
- Double Top
- Triple Bottom
- Triple Bottom
- Triple Top
- Triple Top
- Все
- Все
- Покупка
- Продажа
- Все
- 1
- 2
- 3
- 4
- 5
Double Bottom
was formed on 07.05 at 10:00:56 (UTC+0)
signal strength 2 of 5
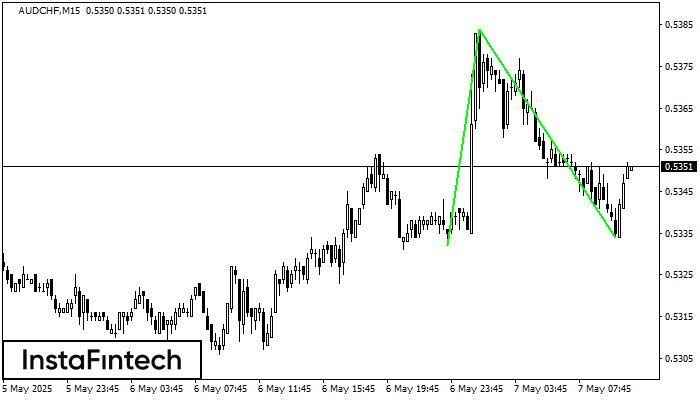
The Double Bottom pattern has been formed on AUDCHF M15; the upper boundary is 0.5384; the lower boundary is 0.5334. The width of the pattern is 52 points. In case
The M5 and M15 time frames may have more false entry points.
Open chart in a new window
Inverse Head and Shoulder
was formed on 07.05 at 10:00:08 (UTC+0)
signal strength 3 of 5
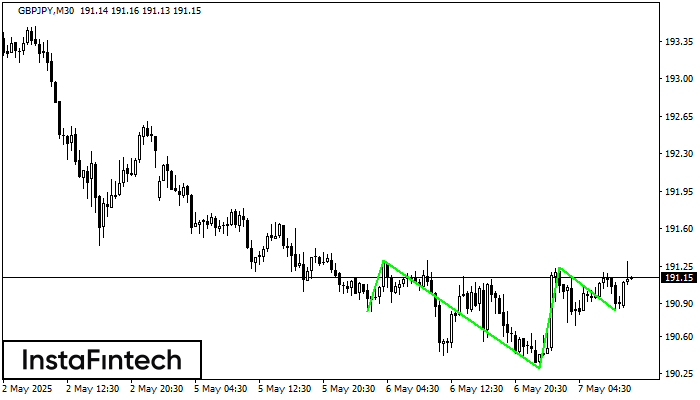
According to the chart of M30, GBPJPY produced the pattern termed the Inverse Head and Shoulder. The Head is fixed at 190.30 while the median line of the Neck
Open chart in a new window
Bullish Rectangle
was formed on 07.05 at 09:17:35 (UTC+0)
signal strength 2 of 5
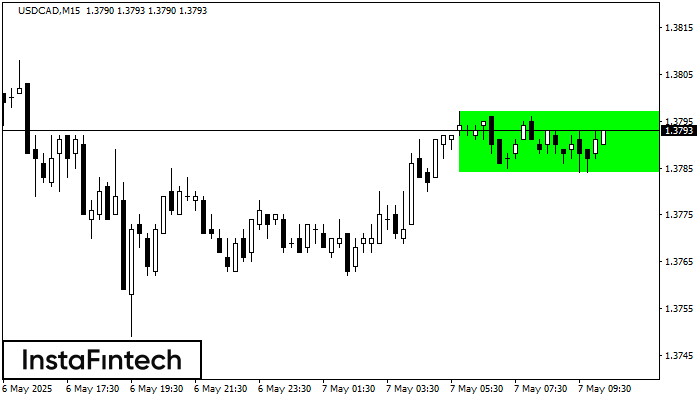
According to the chart of M15, USDCAD formed the Bullish Rectangle. This type of a pattern indicates a trend continuation. It consists of two levels: resistance 1.3797 and support 1.3784
The M5 and M15 time frames may have more false entry points.
Open chart in a new window


