

Долзарб паттернлар

Тройная вершина
сформирован 07.04 в 12:10:10 (UTC+0)
сила сигнала 1 из 5
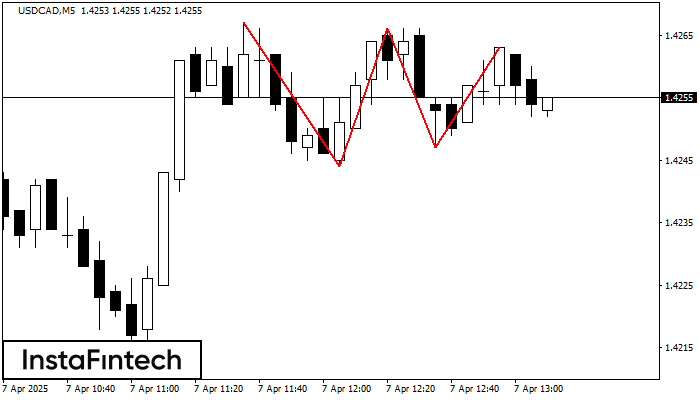
На графике USDCAD M5 образовалась фигура «Тройная вершина». Данная фигура относится к типу разворотных и имеет характеристику: Верхняя граница 1.4267/1.4263; Нижняя граница 1.4244/1.4247; Ширина фигуры 19 пунктов. Прогноз: В случае пробоя нижней границы 1.4244 вероятно дальнейшее нисходящее движение к уровню 1.4251.
Таймфреймы М5 и М15 могут иметь больше ложных точек входа.
- Все
- Все
- Bearish Rectangle
- Bearish Symmetrical Triangle
- Bearish Symmetrical Triangle
- Bullish Rectangle
- Double Top
- Double Top
- Triple Bottom
- Triple Bottom
- Triple Top
- Triple Top
- Все
- Все
- Покупка
- Продажа
- Все
- 1
- 2
- 3
- 4
- 5
Triple Bottom
was formed on 20.04 at 23:32:42 (UTC+0)
signal strength 3 of 5

The Triple Bottom pattern has formed on the chart of AUDCHF M30. Features of the pattern: The lower line of the pattern has coordinates 0.5232 with the upper limit 0.5232/0.5218
Open chart in a new window
Double Top
was formed on 20.04 at 23:10:07 (UTC+0)
signal strength 1 of 5

The Double Top reversal pattern has been formed on #Bitcoin M5. Characteristics: the upper boundary 85197.81; the lower boundary 84993.66; the width of the pattern is 23229 points. Sell trades
The M5 and M15 time frames may have more false entry points.
Open chart in a new window
Bearish Rectangle
was formed on 20.04 at 19:17:25 (UTC+0)
signal strength 1 of 5

According to the chart of M5, #Bitcoin formed the Bearish Rectangle which is a pattern of a trend continuation. The pattern is contained within the following borders: lower border 84213.45
The M5 and M15 time frames may have more false entry points.
Open chart in a new window


