

Долзарб паттернлар

Бычий симметричный треугольник
сформирован 07.04 в 04:20:08 (UTC+0)
сила сигнала 2 из 5
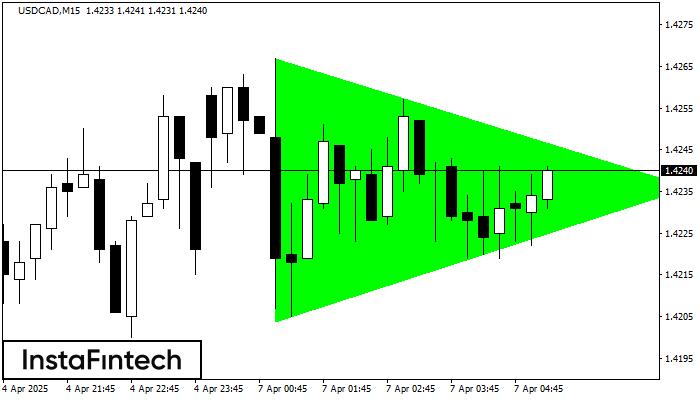
По USDCAD на M15 фигура «Бычий симметричный треугольник». Характеристика: Фигура продолжения тренда; Координаты границ – верхняя 1.4267, нижняя 1.4204. Проекция ширины фигуры 63 пунктов. Прогноз: В случае пробоя верхней границы 1.4267 цена, вероятнее всего, продолжит движение к 1.4259.
Таймфреймы М5 и М15 могут иметь больше ложных точек входа.
- Все
- Все
- Bearish Rectangle
- Bearish Symmetrical Triangle
- Bearish Symmetrical Triangle
- Bullish Rectangle
- Double Top
- Double Top
- Triple Bottom
- Triple Bottom
- Triple Top
- Triple Top
- Все
- Все
- Покупка
- Продажа
- Все
- 1
- 2
- 3
- 4
- 5
Double Bottom
was formed on 21.04 at 02:15:11 (UTC+0)
signal strength 2 of 5
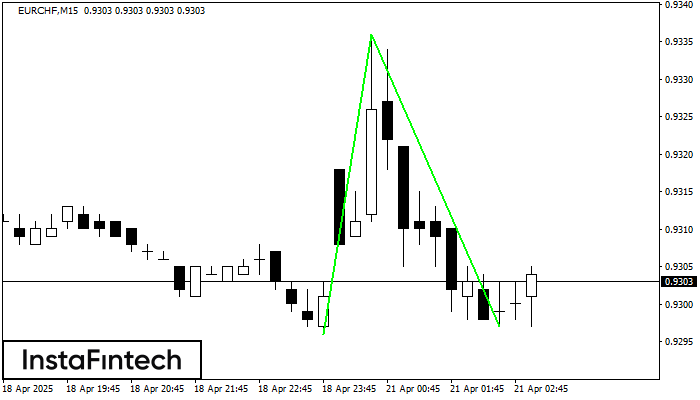
The Double Bottom pattern has been formed on EURCHF M15. Characteristics: the support level 0.9296; the resistance level 0.9336; the width of the pattern 40 points. If the resistance level
The M5 and M15 time frames may have more false entry points.
Open chart in a new window
Double Top
was formed on 21.04 at 02:05:24 (UTC+0)
signal strength 1 of 5
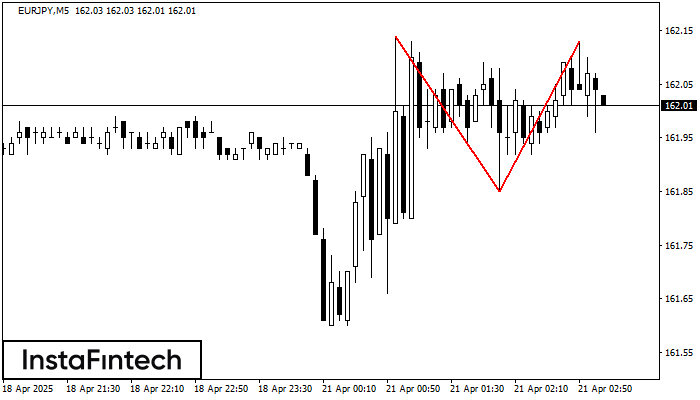
The Double Top pattern has been formed on EURJPY M5. It signals that the trend has been changed from upwards to downwards. Probably, if the base of the pattern 161.85
The M5 and M15 time frames may have more false entry points.
Open chart in a new window
Double Bottom
was formed on 21.04 at 01:55:14 (UTC+0)
signal strength 1 of 5
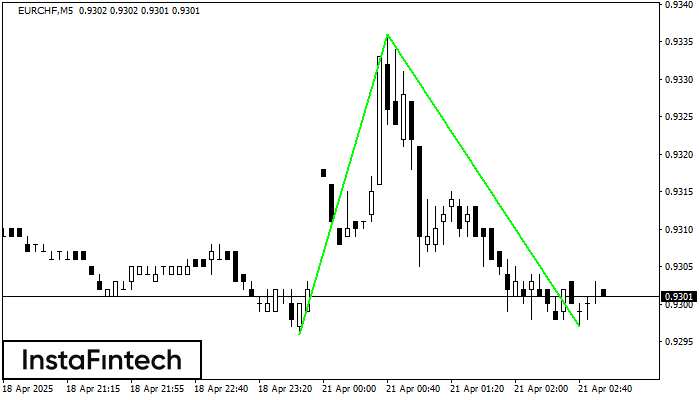
The Double Bottom pattern has been formed on EURCHF M5. Characteristics: the support level 0.9296; the resistance level 0.9336; the width of the pattern 40 points. If the resistance level
The M5 and M15 time frames may have more false entry points.
Open chart in a new window


