

Долзарб паттернлар

Прямоугольник
сформирован 06.04 в 23:00:12 (UTC+0)
сила сигнала 2 из 5
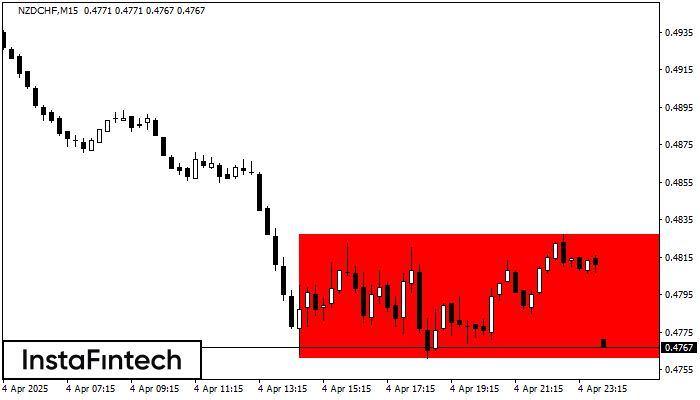
Сформирована фигура «Прямоугольник» на графике NZDCHF M15. Тип фигуры: Продолжение тренда; Границы: Верхняя 0.4827, Нижняя 0.4761; Сигнал: позиция на продажу открывается после фиксации цены ниже границы прямоугольника 0.4761.
Таймфреймы М5 и М15 могут иметь больше ложных точек входа.
- Все
- Все
- Bearish Rectangle
- Bearish Symmetrical Triangle
- Bearish Symmetrical Triangle
- Bullish Rectangle
- Double Top
- Double Top
- Triple Bottom
- Triple Bottom
- Triple Top
- Triple Top
- Все
- Все
- Покупка
- Продажа
- Все
- 1
- 2
- 3
- 4
- 5
Double Top
was formed on 20.04 at 23:10:07 (UTC+0)
signal strength 1 of 5

The Double Top reversal pattern has been formed on #Bitcoin M5. Characteristics: the upper boundary 85197.81; the lower boundary 84993.66; the width of the pattern is 23229 points. Sell trades
The M5 and M15 time frames may have more false entry points.
Open chart in a new window
Bearish Rectangle
was formed on 20.04 at 19:17:25 (UTC+0)
signal strength 1 of 5

According to the chart of M5, #Bitcoin formed the Bearish Rectangle which is a pattern of a trend continuation. The pattern is contained within the following borders: lower border 84213.45
The M5 and M15 time frames may have more false entry points.
Open chart in a new window
Double Bottom
was formed on 20.04 at 18:15:23 (UTC+0)
signal strength 1 of 5

The Double Bottom pattern has been formed on #Bitcoin M5; the upper boundary is 84636.40; the lower boundary is 84234.35. The width of the pattern is 42295 points. In case
The M5 and M15 time frames may have more false entry points.
Open chart in a new window


