

Долзарб паттернлар

Медвежий флаг
сформирован 04.04 в 17:33:28 (UTC+0)
сила сигнала 2 из 5

На графике #TSLA M15 сформировалась фигура «Медвежий флаг», которая сигнализирует о продолжении нисходящего тренда. В случае, если цена зафиксируется ниже минимума фигуры 235.81, движение вниз, скорее всего, продолжится. Перспективой будущего движения будет являться проекция высоты флагштока (15 пунктов).
Таймфреймы М5 и М15 могут иметь больше ложных точек входа.
Шунингдек кўринг
- Все
- Все
- Bearish Rectangle
- Bearish Symmetrical Triangle
- Bearish Symmetrical Triangle
- Bullish Rectangle
- Double Top
- Double Top
- Triple Bottom
- Triple Bottom
- Triple Top
- Triple Top
- Все
- Все
- Покупка
- Продажа
- Все
- 1
- 2
- 3
- 4
- 5
Bearish Rectangle
was formed on 05.05 at 18:28:29 (UTC+0)
signal strength 1 of 5
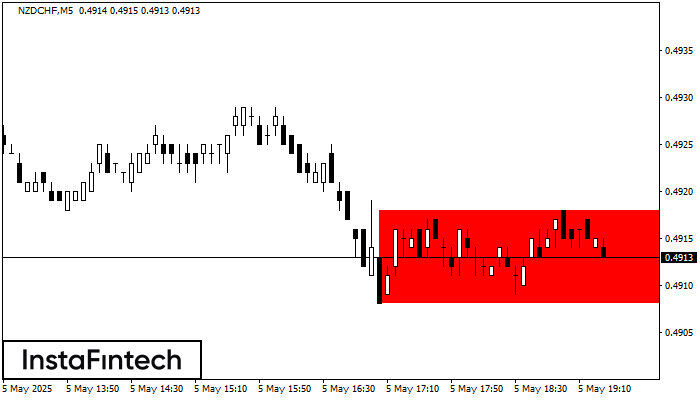
According to the chart of M5, NZDCHF formed the Bearish Rectangle. This type of a pattern indicates a trend continuation. It consists of two levels: resistance 0.4918 - 0.0000
The M5 and M15 time frames may have more false entry points.
Open chart in a new window
Bullish Symmetrical Triangle
was formed on 05.05 at 18:05:07 (UTC+0)
signal strength 1 of 5
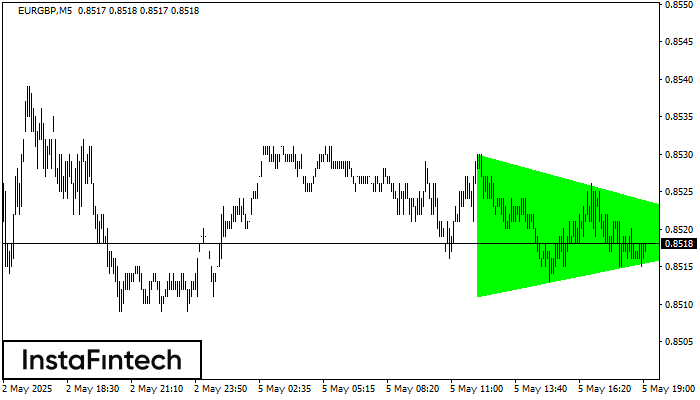
According to the chart of M5, EURGBP formed the Bullish Symmetrical Triangle pattern. The lower border of the pattern touches the coordinates 0.8511/0.8519 whereas the upper border goes across 0.8530/0.8519
The M5 and M15 time frames may have more false entry points.
Open chart in a new window
Double Bottom
was formed on 05.05 at 18:04:57 (UTC+0)
signal strength 1 of 5
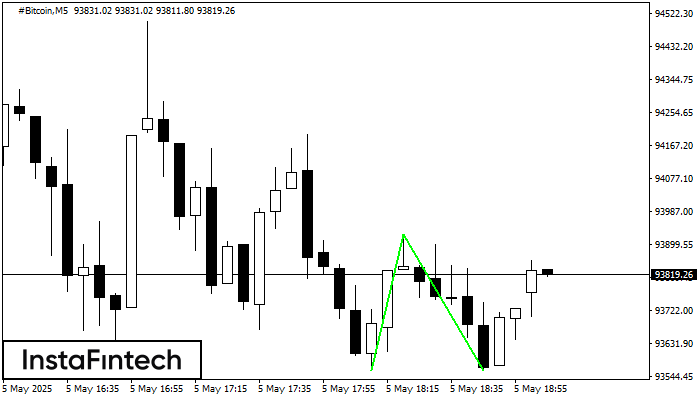
The Double Bottom pattern has been formed on #Bitcoin M5; the upper boundary is 93926.12; the lower boundary is 93560.62. The width of the pattern is 36607 points. In case
The M5 and M15 time frames may have more false entry points.
Open chart in a new window


