

Долзарб паттернлар

Двойное дно
сформирован 02.04 в 18:55:21 (UTC+0)
сила сигнала 1 из 5
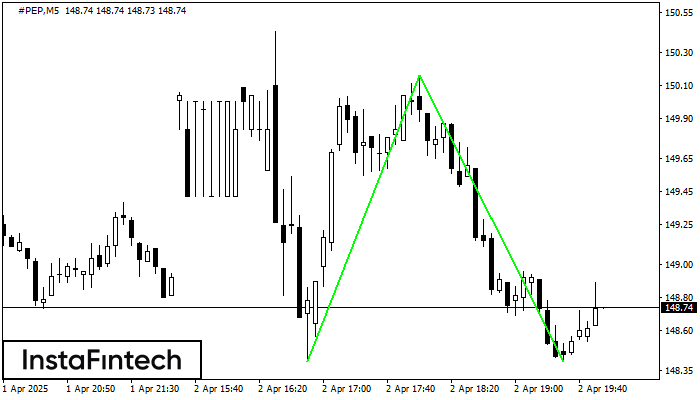
Сформирована фигура «Двойное дно» на графике #PEP M5. Верхняя граница 150.16; Нижняя граница 148.41; Ширина фигуры 175 пунктов. В случае пробоя верхней границы 150.16 можно будет прогнозировать изменение тенденции, где ширина фигуры и будет являться расстоянием предположительного Тейк Профита.
Таймфреймы М5 и М15 могут иметь больше ложных точек входа.
- Все
- Все
- Bearish Rectangle
- Bearish Symmetrical Triangle
- Bearish Symmetrical Triangle
- Bullish Rectangle
- Double Top
- Double Top
- Triple Bottom
- Triple Bottom
- Triple Top
- Triple Top
- Все
- Все
- Покупка
- Продажа
- Все
- 1
- 2
- 3
- 4
- 5
Double Top
сформирован 22.04 в 09:00:07 (UTC+0)
сила сигнала 4 из 5

The Double Top pattern has been formed on NZDCAD H1. It signals that the trend has been changed from upwards to downwards. Probably, if the base of the pattern 0.8276
Открыть график инструмента в новом окне
Head and Shoulders
сформирован 22.04 в 08:55:22 (UTC+0)
сила сигнала 1 из 5

The technical pattern called Head and Shoulders has appeared on the chart of GOLD M5. There are weighty reasons to suggest that the price will surpass the Neckline 3473.12/3476.36 after
The M5 and M15 time frames may have more false entry points.
Открыть график инструмента в новом окне
Bearish Symmetrical Triangle
сформирован 22.04 в 08:47:25 (UTC+0)
сила сигнала 1 из 5

According to the chart of M5, EURNZD formed the Bearish Symmetrical Triangle pattern. This pattern signals a further downward trend in case the lower border 1.9139 is breached. Here
The M5 and M15 time frames may have more false entry points.
Открыть график инструмента в новом окне


