

Долзарб паттернлар

Прямоугольник
сформирован 01.04 в 07:00:39 (UTC+0)
сила сигнала 4 из 5
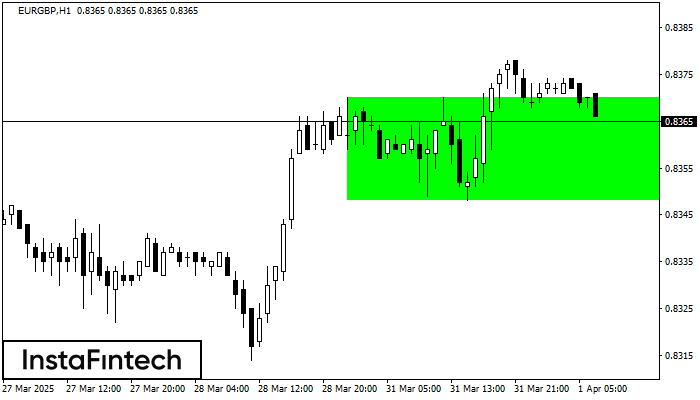
Сформирована фигура «Прямоугольник» на графике EURGBP H1. Тип фигуры: Продолжение тренда; Границы: Верхняя 0.8370, Нижняя 0.8348; Сигнал: позицию на покупку следует открывать выше верхней границы прямоугольника 0.8370.
- Все
- Все
- Bearish Rectangle
- Bearish Symmetrical Triangle
- Bearish Symmetrical Triangle
- Bullish Rectangle
- Double Top
- Double Top
- Triple Bottom
- Triple Bottom
- Triple Top
- Triple Top
- Все
- Все
- Покупка
- Продажа
- Все
- 1
- 2
- 3
- 4
- 5
Bullish Symmetrical Triangle
сформирован 06.05 в 21:02:39 (UTC+0)
сила сигнала 1 из 5
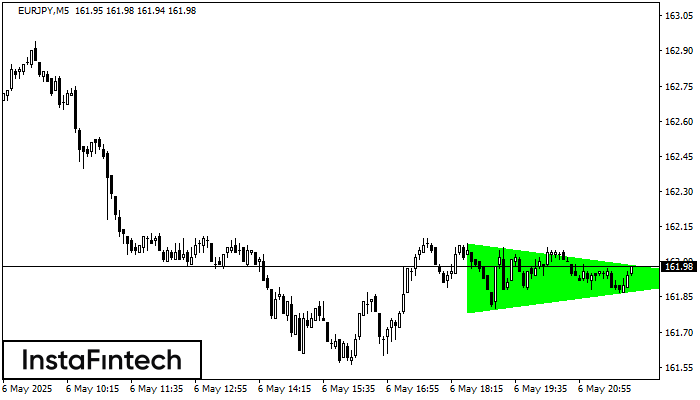
According to the chart of M5, EURJPY formed the Bullish Symmetrical Triangle pattern. Description: This is the pattern of a trend continuation. 162.08 and 161.78 are the coordinates
The M5 and M15 time frames may have more false entry points.
Открыть график инструмента в новом окне
Bullish Rectangle
сформирован 06.05 в 21:00:23 (UTC+0)
сила сигнала 3 из 5
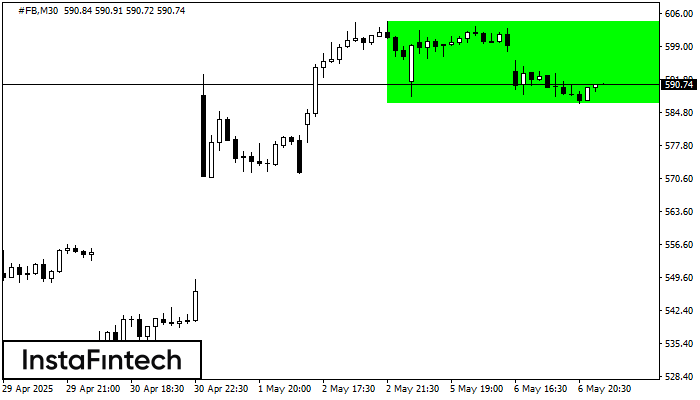
According to the chart of M30, #FB formed the Bullish Rectangle. This type of a pattern indicates a trend continuation. It consists of two levels: resistance 604.25 and support 586.62
Открыть график инструмента в новом окне
Double Top
сформирован 06.05 в 21:00:13 (UTC+0)
сила сигнала 1 из 5
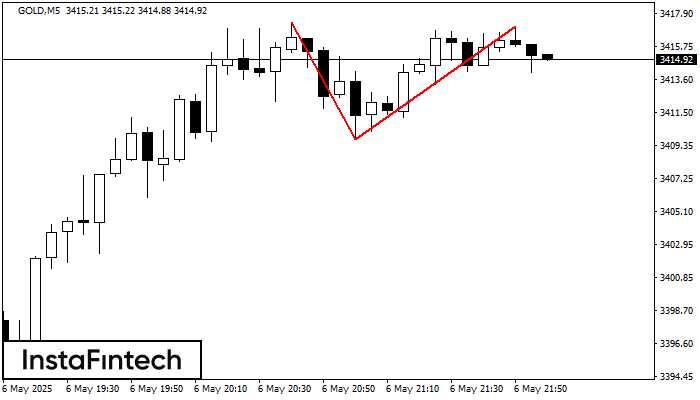
The Double Top pattern has been formed on GOLD M5. It signals that the trend has been changed from upwards to downwards. Probably, if the base of the pattern 3409.73
The M5 and M15 time frames may have more false entry points.
Открыть график инструмента в новом окне


