

Долзарб паттернлар

Двойное дно
сформирован 30.03 в 14:25:09 (UTC+0)
сила сигнала 1 из 5
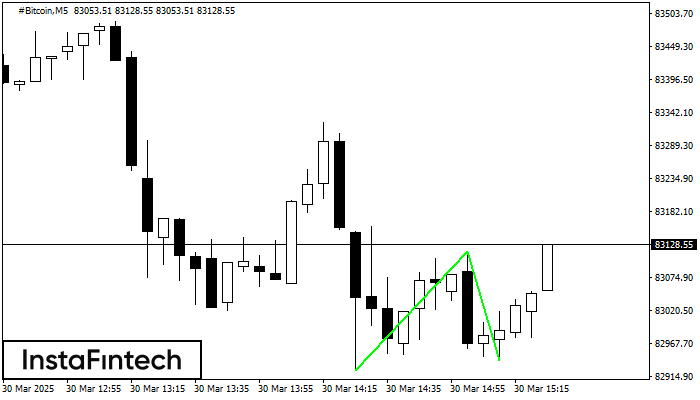
Сформирована фигура «Двойное дно» на графике #Bitcoin M5. Данное формирование сигнализирует об изменении тенденции с нисходящего на восходящее движение. Сигнал: Торговую позицию на покупку следует открывать после пробоя верхней границы фигуры 83117.65, где перспектива будущего хода будет являться шириной текущей фигуры - 19331 пунктов.
Таймфреймы М5 и М15 могут иметь больше ложных точек входа.
- Все
- Все
- Bearish Rectangle
- Bearish Symmetrical Triangle
- Bearish Symmetrical Triangle
- Bullish Rectangle
- Double Top
- Double Top
- Triple Bottom
- Triple Bottom
- Triple Top
- Triple Top
- Все
- Все
- Покупка
- Продажа
- Все
- 1
- 2
- 3
- 4
- 5
Double Bottom
was formed on 03.05 at 10:45:44 (UTC+0)
signal strength 2 of 5

Corak Double Bottom telah dibentuk pada #Bitcoin M15. Pembentukan ini menandakan pembalikan aliran dari aliran menurun ke atas. Isyarat ialah perdagangan membeli harus dibuka selepas sempadan atas corak 96350.17 telah
Carta masa M5 dan M15 mungkin mempunyai lebih banyak titik kemasukan palsu.
Open chart in a new window
Double Bottom
was formed on 03.05 at 08:00:01 (UTC+0)
signal strength 3 of 5

Corak Double Bottom telah dibentuk pada #Bitcoin M30; sempadan atas adalah 97860.25; sempadan bawah adalah 96258.44. Lebar corak adalah 156618 mata. Sekiranya penembusan sempadan atas 97860.25, perubahan aliran boleh diramalkan
Open chart in a new window
Double Bottom
was formed on 03.05 at 06:20:09 (UTC+0)
signal strength 1 of 5

Corak Double Bottom telah dibentuk pada #Bitcoin M5; sempadan atas adalah 96467.62; sempadan bawah adalah 96258.44. Lebar corak adalah 20692 mata. Sekiranya penembusan sempadan atas 96467.62, perubahan aliran boleh diramalkan
Carta masa M5 dan M15 mungkin mempunyai lebih banyak titik kemasukan palsu.
Open chart in a new window


