

Долзарб паттернлар

Голова и плечи
сформирован 25.03 в 03:30:30 (UTC+0)
сила сигнала 2 из 5

На графике #Bitcoin M15 сформировалась фигура «Голова и плечи» с характеристикой: Вершина головы 88742.88; Уровень шеи, восходящий угол - 87100.22/87010.53. Формирование данной фигуры может привести к изменению текущей тенденции с восходящей на нисходящую. Вероятно предполагать, что курс #Bitcoin, в случае срабатывания фигуры, пойдет в направлении 87010.30 (15 - 30 пунктов).
Таймфреймы М5 и М15 могут иметь больше ложных точек входа.
Шунингдек кўринг
- Все
- Все
- Bearish Rectangle
- Bearish Symmetrical Triangle
- Bearish Symmetrical Triangle
- Bullish Rectangle
- Double Top
- Double Top
- Triple Bottom
- Triple Bottom
- Triple Top
- Triple Top
- Все
- Все
- Покупка
- Продажа
- Все
- 1
- 2
- 3
- 4
- 5
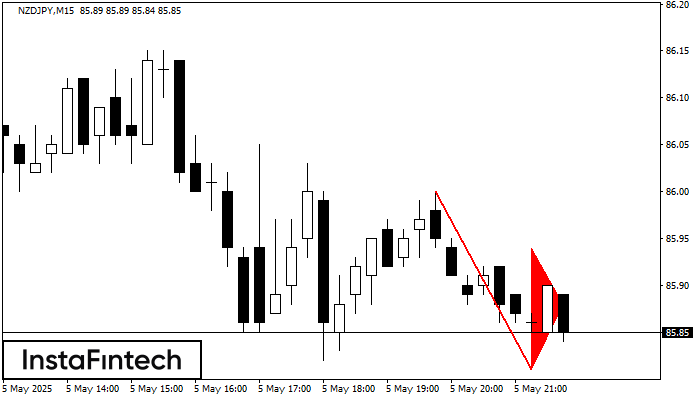
Медвежий флаг
сформирован 05.05 в 20:52:49 (UTC+0)
сила сигнала 2 из 5
На графике NZDJPY M15 сформировалась графическая фигура «Медвежий флаг». Ссылаясь на теорию графического анализа, можно сказать, что в ближайшее время тренд продолжит нисходящее движение, как только цена зафиксируется ниже минимума
Таймфреймы М5 и М15 могут иметь больше ложных точек входа.
Открыть график инструмента в новом окне
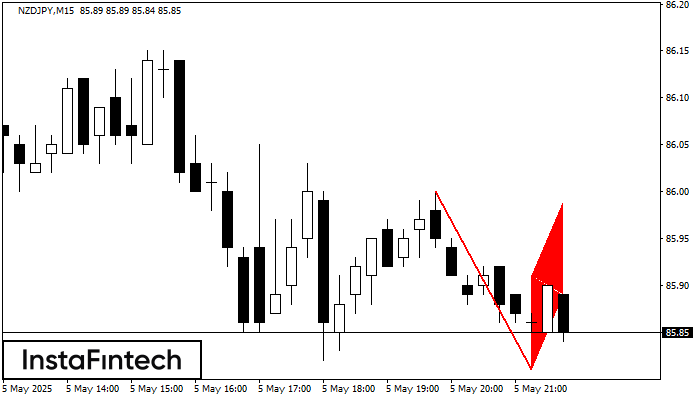
Медвежий вымпел
сформирован 05.05 в 20:52:44 (UTC+0)
сила сигнала 2 из 5
На графике NZDJPY M15 сформировалась фигура «Медвежий вымпел», которая сигнализирует о возможном продолжении тренда. Характеристика: основание фигуры имеет координаты 85.81; проекция высоты флагштока равна 19 пунктов. В случае если цена
Таймфреймы М5 и М15 могут иметь больше ложных точек входа.
Открыть график инструмента в новом окне
Двойная вершина
сформирован 05.05 в 19:45:28 (UTC+0)
сила сигнала 2 из 5
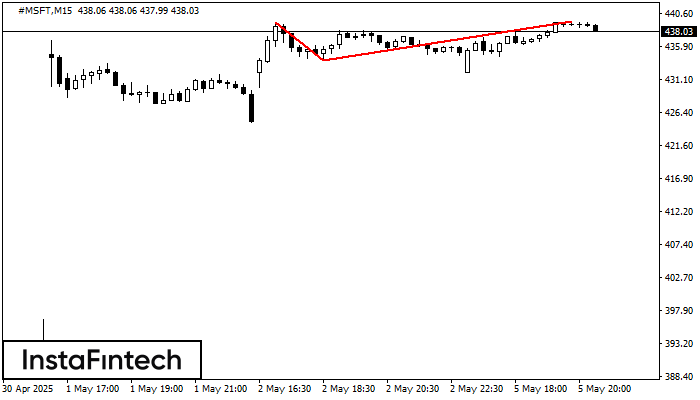
По торговому инструменту #MSFT на M15 сформировалась фигура «Двойная вершина», которая сигнализирует нам об изменении тенденции с восходящей на нисходящую. Вероятно, что, в случае пробоя основания фигуры 433.94, возможно дальнейшее
Таймфреймы М5 и М15 могут иметь больше ложных точек входа.
Открыть график инструмента в новом окне


