

Долзарб паттернлар

Двойное дно
сформирован 25.03 в 02:55:11 (UTC+0)
сила сигнала 1 из 5
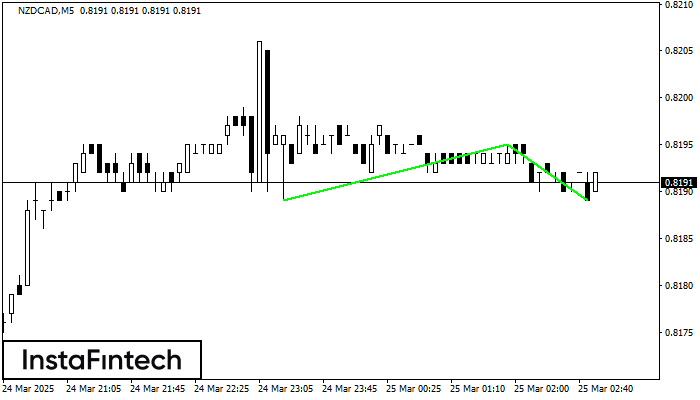
Сформирована фигура «Двойное дно» на графике NZDCAD M5. Верхняя граница 0.8195; Нижняя граница 0.8189; Ширина фигуры 6 пунктов. В случае пробоя верхней границы 0.8195 можно будет прогнозировать изменение тенденции, где ширина фигуры и будет являться расстоянием предположительного Тейк Профита.
Таймфреймы М5 и М15 могут иметь больше ложных точек входа.
Шунингдек кўринг
- Все
- Все
- Bearish Rectangle
- Bearish Symmetrical Triangle
- Bearish Symmetrical Triangle
- Bullish Rectangle
- Double Top
- Double Top
- Triple Bottom
- Triple Bottom
- Triple Top
- Triple Top
- Все
- Все
- Покупка
- Продажа
- Все
- 1
- 2
- 3
- 4
- 5
Triple Bottom
was formed on 02.05 at 22:50:22 (UTC+0)
signal strength 1 of 5

The Triple Bottom pattern has been formed on EURGBP M5. It has the following characteristics: resistance level 0.8515/0.8514; support level 0.8509/0.8509; the width is 6 points. In the event
The M5 and M15 time frames may have more false entry points.
Open chart in a new window
Double Top
was formed on 02.05 at 21:50:15 (UTC+0)
signal strength 1 of 5

The Double Top reversal pattern has been formed on USDJPY M5. Characteristics: the upper boundary 145.09; the lower boundary 144.90; the width of the pattern is 18 points. Sell trades
The M5 and M15 time frames may have more false entry points.
Open chart in a new window
Triple Bottom
was formed on 02.05 at 21:45:21 (UTC+0)
signal strength 1 of 5

The Triple Bottom pattern has been formed on EURGBP M5. It has the following characteristics: resistance level 0.8515/0.8514; support level 0.8509/0.8509; the width is 6 points. In the event
The M5 and M15 time frames may have more false entry points.
Open chart in a new window


