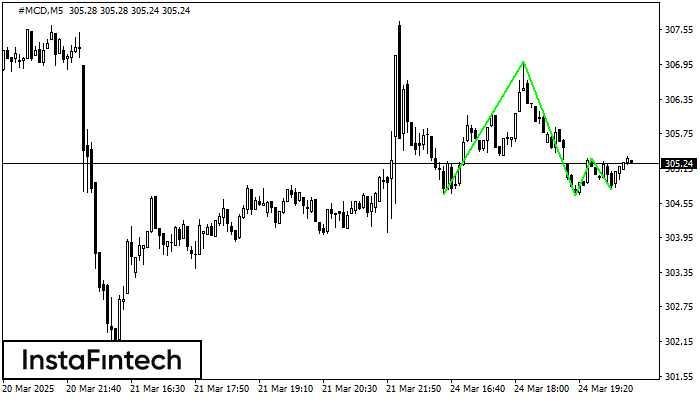
Тройное дно
сформирован 24.03 в 20:25:19 (UTC+0)
сила сигнала 1 из 5

Сформирована фигура «Тройное дно» по торговому инструменту #MCD на M5. Фигура сигнализирует об изменении тенденции с нисходящей на восходящую в случае пробоя верхней границы 305.33.
Таймфреймы М5 и М15 могут иметь больше ложных точек входа.
- Все
- Все
- Bearish Rectangle
- Bearish Symmetrical Triangle
- Bearish Symmetrical Triangle
- Bullish Rectangle
- Double Top
- Double Top
- Triple Bottom
- Triple Bottom
- Triple Top
- Triple Top
- Все
- Все
- Покупка
- Продажа
- Все
- 1
- 2
- 3
- 4
- 5
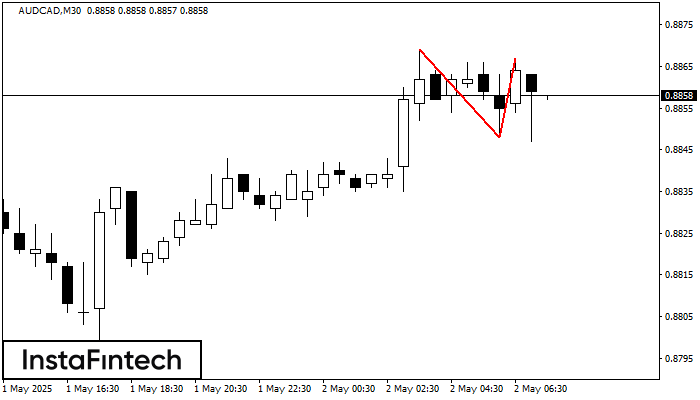
Doble Techo
was formed on 02.05 at 06:30:42 (UTC+0)
signal strength 3 of 5
El patrón Doble Techo ha sido formado en AUDCAD M30. Esto señala que la tendencia ha sido cambiada de alcista a bajista. Probablemente, si la base del patrón 0.8848
Open chart in a new window
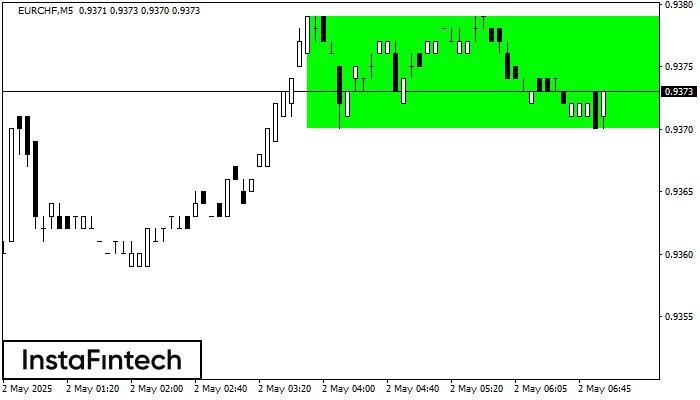
Rectángulo Alcista
was formed on 02.05 at 06:03:50 (UTC+0)
signal strength 1 of 5
Según el gráfico de M5, EURCHF formó el Rectángulo Alcista que es un patrón de la continuación de una tendencia. El patrón está contenido dentro de los siguientes límites
Los marcos de tiempo M5 y M15 pueden tener más puntos de entrada falsos.
Open chart in a new window
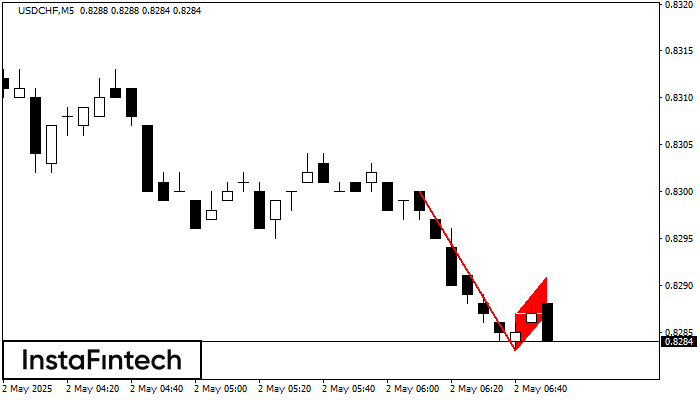
Bandera bajista
was formed on 02.05 at 05:53:04 (UTC+0)
signal strength 1 of 5
El patrón Bandera bajista ha sido formado en USDCHF a M5. El límite inferior del patrón está ubicado en 0.8283/0.8287 mientras el límite superior se encuentra en 0.8287/0.8291. La proyección
Los marcos de tiempo M5 y M15 pueden tener más puntos de entrada falsos.
Open chart in a new window


