

Долзарб паттернлар

Бычий вымпел
сформирован 24.03 в 00:55:24 (UTC+0)
сила сигнала 1 из 5
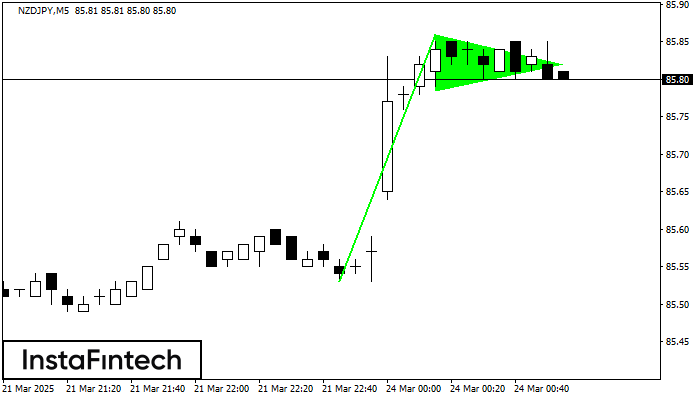
Сигнал «Бычий вымпел» – Торговый инструмент NZDJPY M5, фигура продолжения тенденции. Прогноз: позицию на покупку можно открывать выше максимума фигуры 85.86, где перспектива будущего хода будет являться проекцией высоты флагштока.
Таймфреймы М5 и М15 могут иметь больше ложных точек входа.
- Все
- Все
- Bearish Rectangle
- Bearish Symmetrical Triangle
- Bearish Symmetrical Triangle
- Bullish Rectangle
- Double Top
- Double Top
- Triple Bottom
- Triple Bottom
- Triple Top
- Triple Top
- Все
- Все
- Покупка
- Продажа
- Все
- 1
- 2
- 3
- 4
- 5
Bullish Rectangle
was formed on 02.05 at 18:06:10 (UTC+0)
signal strength 1 of 5
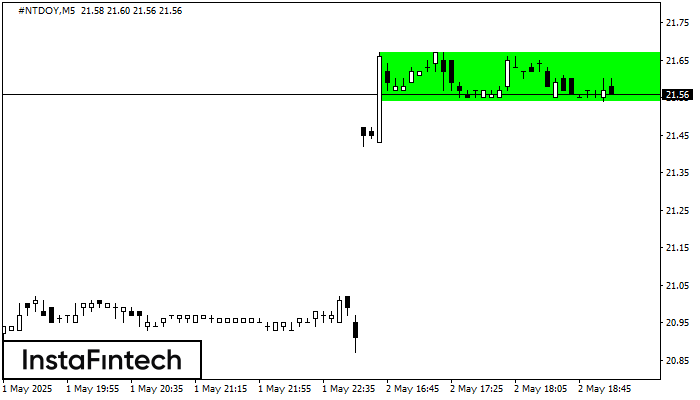
According to the chart of M5, #NTDOY formed the Bullish Rectangle. The pattern indicates a trend continuation. The upper border is 21.67, the lower border is 21.54. The signal means
The M5 and M15 time frames may have more false entry points.
Open chart in a new window
Bullish Rectangle
was formed on 02.05 at 18:06:01 (UTC+0)
signal strength 1 of 5
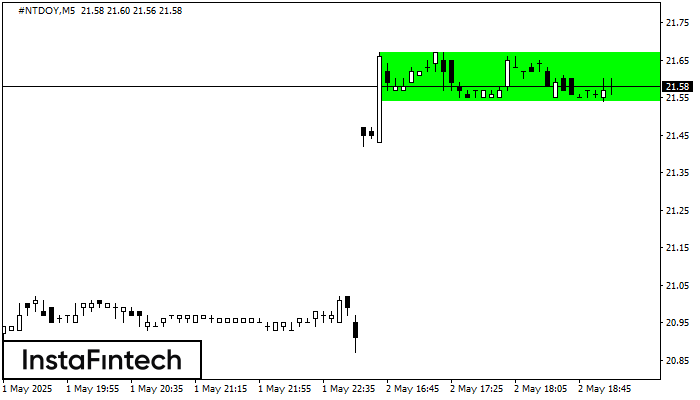
According to the chart of M5, #NTDOY formed the Bullish Rectangle. The pattern indicates a trend continuation. The upper border is 21.67, the lower border is 21.54. The signal means
The M5 and M15 time frames may have more false entry points.
Open chart in a new window
Bearish Rectangle
was formed on 02.05 at 18:02:08 (UTC+0)
signal strength 1 of 5
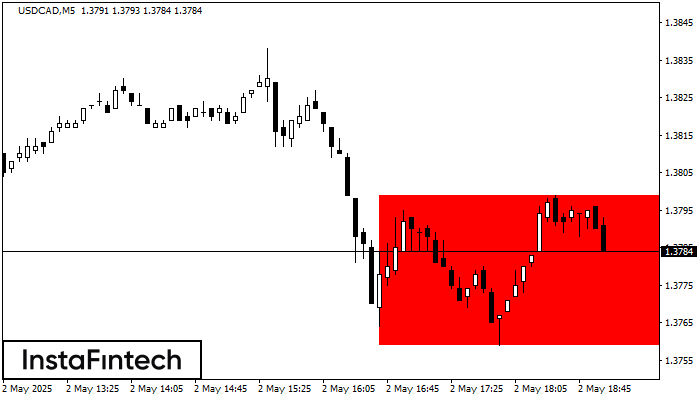
According to the chart of M5, USDCAD formed the Bearish Rectangle. The pattern indicates a trend continuation. The upper border is 1.3799, the lower border is 1.3759. The signal means
The M5 and M15 time frames may have more false entry points.
Open chart in a new window


