

Actual patterns

Patterns are graphical models which are formed in the chart by the price. According to one of the technical analysis postulates, history (price movement) repeats itself. It means that the price movements are often similar in the same situations which makes it possible to predict the further development of the situation with a high probability.
Relevant patterns by InstaTrade is an easy-to-use service which allows you to be aware of latest changes in the market and react to clues from the market in time. In our service you will always find the latest and most relevant patterns on any pair and any timeframe.
Bullish Symmetrical Triangle
was formed on 07.04 at 05:53:18 (UTC+0)
signal strength 1 of 5
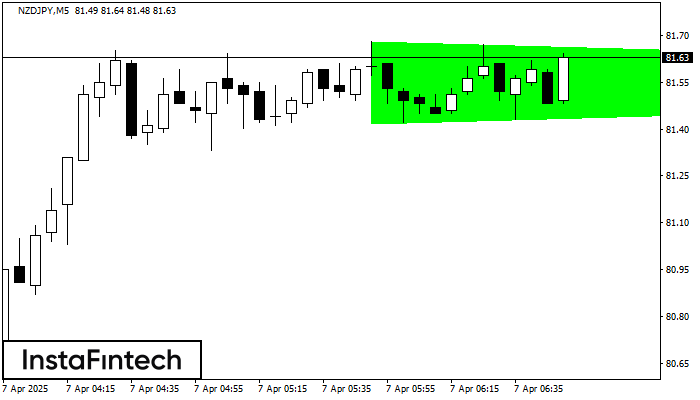
According to the chart of M5, NZDJPY formed the Bullish Symmetrical Triangle pattern. The lower border of the pattern touches the coordinates 81.42/81.55 whereas the upper border goes across 81.68/81.55. If the Bullish Symmetrical Triangle pattern is in progress, this evidently signals a further upward trend. In other words, in case the scenario comes true, the price of NZDJPY will breach the upper border to head for 81.70.
The M5 and M15 time frames may have more false entry points.
- All
- All
- Bearish Rectangle
- Bearish Symmetrical Triangle
- Bearish Symmetrical Triangle
- Bullish Rectangle
- Double Top
- Double Top
- Triple Bottom
- Triple Bottom
- Triple Top
- Triple Top
- All
- All
- Buy
- Sale
- All
- 1
- 2
- 3
- 4
- 5
Cabeça & Ombros
was formed on 21.05 at 03:00:10 (UTC+0)
signal strength 3 of 5
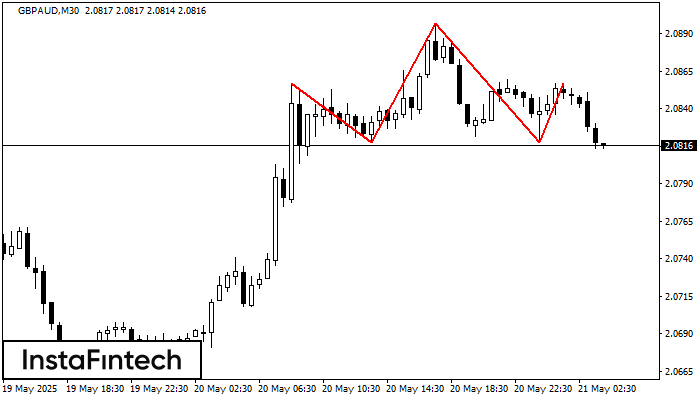
Os GBPAUD M30 formaram o padrão Cabeça & Ombros com as seguintes características: O topo da cabeça está em 2.0897, a linha do pescoço e o ângulo para cima estão
Open chart in a new window
Topo triplo
was formed on 21.05 at 02:00:36 (UTC+0)
signal strength 3 of 5
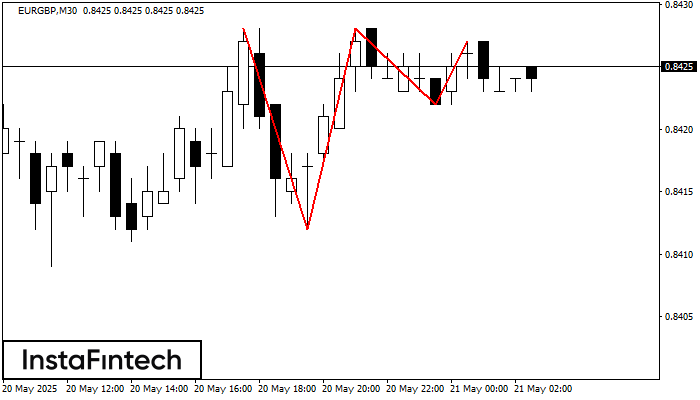
No gráfico do instrumento de negociação EURGBP M30, o padrão Topo triplo que sinaliza uma mudança de tendência se formou. É possível que após a formação do terceiro pico
Open chart in a new window
Retângulo de alta
was formed on 21.05 at 00:46:25 (UTC+0)
signal strength 1 of 5
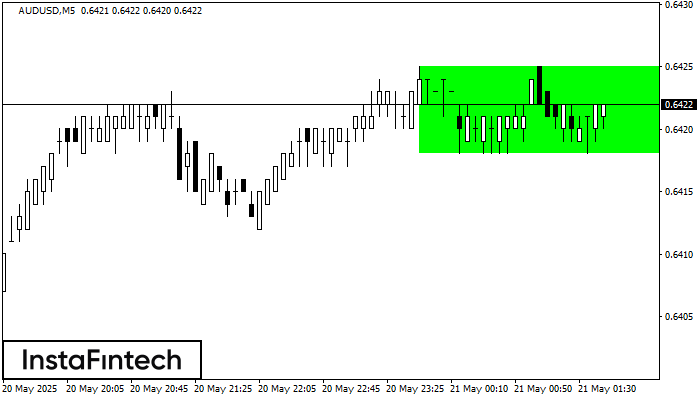
De acordo com o gráfico de M5, AUDUSD formou o Retângulo de alta que é um padrão de uma continuação da tendência. O padrão está dentro dos seguintes limites
Os intervalos M5 e M15 podem ter mais pontos de entrada falsos.
Open chart in a new window


