

Actual patterns

Patterns are graphical models which are formed in the chart by the price. According to one of the technical analysis postulates, history (price movement) repeats itself. It means that the price movements are often similar in the same situations which makes it possible to predict the further development of the situation with a high probability.
Relevant patterns by InstaTrade is an easy-to-use service which allows you to be aware of latest changes in the market and react to clues from the market in time. In our service you will always find the latest and most relevant patterns on any pair and any timeframe.
Bearish pennant
was formed on 04.04 at 16:10:48 (UTC+0)
signal strength 1 of 5
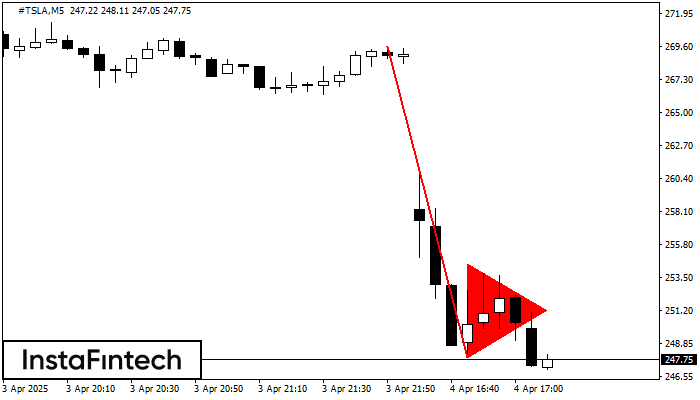
The Bearish pennant pattern has formed on the #TSLA M5 chart. It signals potential continuation of the existing trend. Specifications: the pattern’s bottom has the coordinate of 247.91; the projection of the flagpole height is equal to 2171 pips. In case the price breaks out the pattern’s bottom of 247.91, the downtrend is expected to continue for further level 247.76.
The M5 and M15 time frames may have more false entry points.
See Also
- All
- All
- Bearish Rectangle
- Bearish Symmetrical Triangle
- Bearish Symmetrical Triangle
- Bullish Rectangle
- Double Top
- Double Top
- Triple Bottom
- Triple Bottom
- Triple Top
- Triple Top
- All
- All
- Buy
- Sale
- All
- 1
- 2
- 3
- 4
- 5
Bullish Rectangle
was formed on 02.06 at 22:15:32 (UTC+0)
signal strength 4 of 5
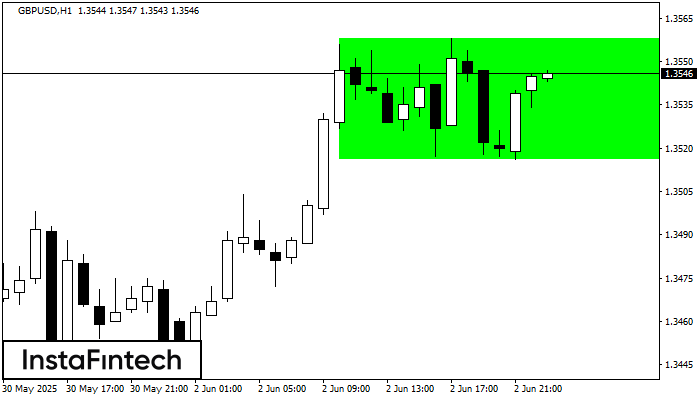
According to the chart of H1, GBPUSD formed the Bullish Rectangle. This type of a pattern indicates a trend continuation. It consists of two levels: resistance 1.3558 and support 1.3516
Open chart in a new window
Bullish Symmetrical Triangle
was formed on 02.06 at 22:06:22 (UTC+0)
signal strength 1 of 5
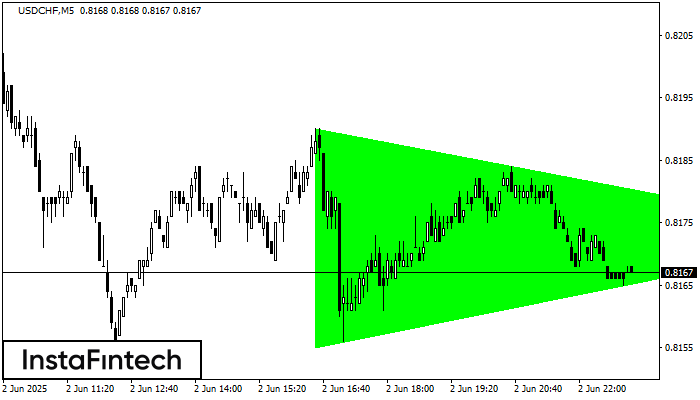
According to the chart of M5, USDCHF formed the Bullish Symmetrical Triangle pattern, which signals the trend will continue. Description. The upper border of the pattern touches the coordinates 0.8190/0.8173
The M5 and M15 time frames may have more false entry points.
Open chart in a new window
Bearish Symmetrical Triangle
was formed on 02.06 at 21:58:20 (UTC+0)
signal strength 1 of 5
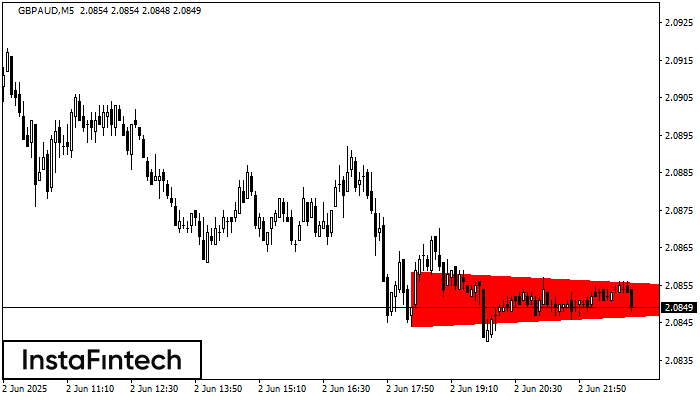
According to the chart of M5, GBPAUD formed the Bearish Symmetrical Triangle pattern. Description: The lower border is 2.0844/2.0851 and upper border is 2.0859/2.0851. The pattern width is measured
The M5 and M15 time frames may have more false entry points.
Open chart in a new window


