

Actual patterns

Patterns are graphical models which are formed in the chart by the price. According to one of the technical analysis postulates, history (price movement) repeats itself. It means that the price movements are often similar in the same situations which makes it possible to predict the further development of the situation with a high probability.
Relevant patterns by InstaTrade is an easy-to-use service which allows you to be aware of latest changes in the market and react to clues from the market in time. In our service you will always find the latest and most relevant patterns on any pair and any timeframe.
Triple Bottom
was formed on 02.04 at 20:05:06 (UTC+0)
signal strength 1 of 5
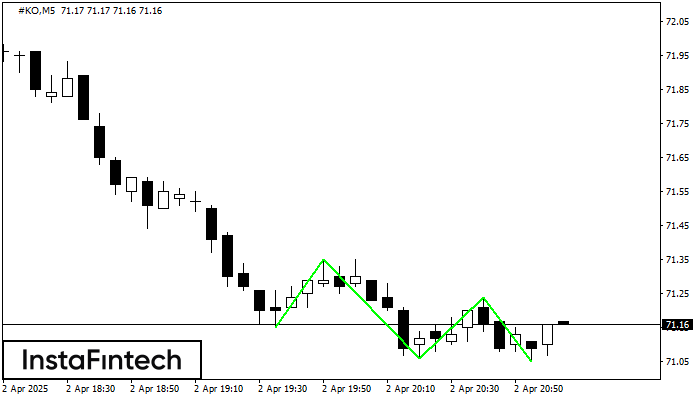
The Triple Bottom pattern has been formed on #KO M5. It has the following characteristics: resistance level 71.35/71.24; support level 71.15/71.05; the width is 20 points. In the event of a breakdown of the resistance level of 71.35, the price is likely to continue an upward movement at least to 71.21.
The M5 and M15 time frames may have more false entry points.
- All
- All
- Bearish Rectangle
- Bearish Symmetrical Triangle
- Bearish Symmetrical Triangle
- Bullish Rectangle
- Double Top
- Double Top
- Triple Bottom
- Triple Bottom
- Triple Top
- Triple Top
- All
- All
- Buy
- Sale
- All
- 1
- 2
- 3
- 4
- 5
Topo duplo
was formed on 29.05 at 02:00:28 (UTC+0)
signal strength 3 of 5
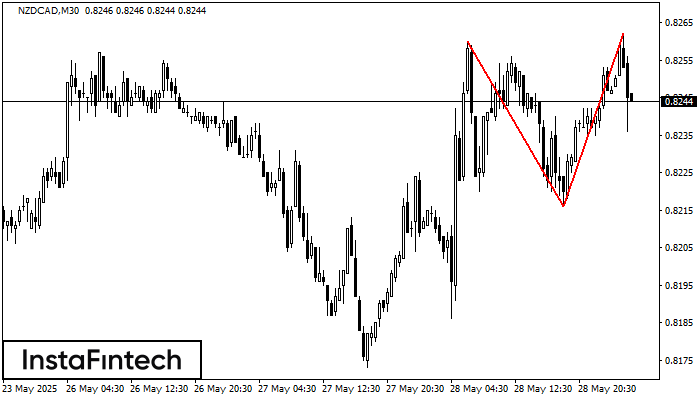
No gráfico de NZDCAD M30 o padrão de reversão Topo duplo foi formado. Características: o limite superior 0.8262; o limite inferior 0.8216; a largura do padrão 46 pontos. O sinal
Open chart in a new window
Bandeira de Alta
was formed on 29.05 at 01:05:37 (UTC+0)
signal strength 1 of 5
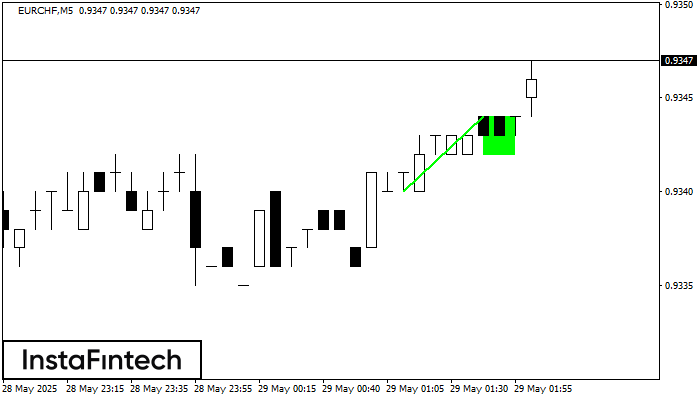
O padrão Bandeira de Alta foi formado no gráfico EURCHF M5, o que sinaliza que a tendência ascendente continuará. Sinais: uma quebra do pico em 0.9344 pode empurrar o preço
Os intervalos M5 e M15 podem ter mais pontos de entrada falsos.
Open chart in a new window
Retângulo de baixa
was formed on 29.05 at 01:02:33 (UTC+0)
signal strength 2 of 5
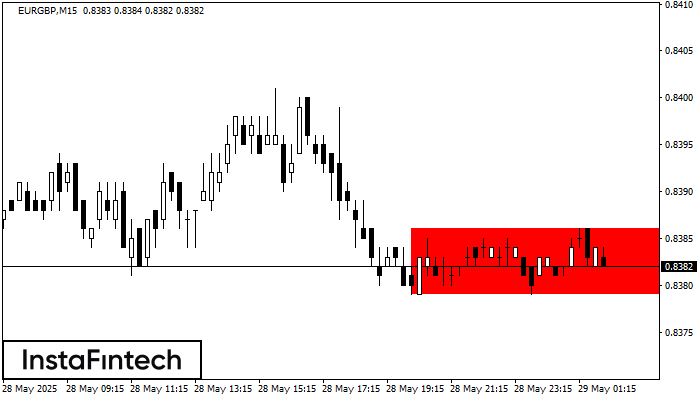
De acordo com o gráfico de M15, EURGBP formou Retângulo de baixa. Este tipo de padrão indica uma continuação da tendência. Ele consiste em dois níveis: resistência 0.8386 – 0.0000
Os intervalos M5 e M15 podem ter mais pontos de entrada falsos.
Open chart in a new window


