

Actual patterns

Patterns are graphical models which are formed in the chart by the price. According to one of the technical analysis postulates, history (price movement) repeats itself. It means that the price movements are often similar in the same situations which makes it possible to predict the further development of the situation with a high probability.
Relevant patterns by InstaTrade is an easy-to-use service which allows you to be aware of latest changes in the market and react to clues from the market in time. In our service you will always find the latest and most relevant patterns on any pair and any timeframe.
Bullish Rectangle
was formed on 26.03 at 14:44:03 (UTC+0)
signal strength 2 of 5
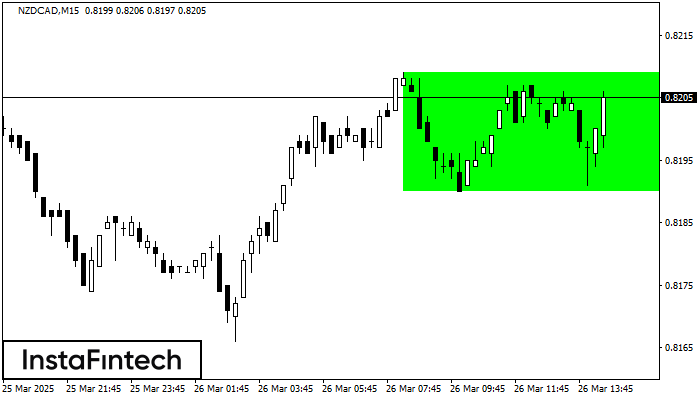
According to the chart of M15, NZDCAD formed the Bullish Rectangle which is a pattern of a trend continuation. The pattern is contained within the following borders: the lower border 0.8190 – 0.8190 and upper border 0.8209 – 0.8209. In case the upper border is broken, the instrument is likely to follow the upward trend.
The M5 and M15 time frames may have more false entry points.
- All
- All
- Bearish Rectangle
- Bearish Symmetrical Triangle
- Bearish Symmetrical Triangle
- Bullish Rectangle
- Double Top
- Double Top
- Triple Bottom
- Triple Bottom
- Triple Top
- Triple Top
- All
- All
- Buy
- Sale
- All
- 1
- 2
- 3
- 4
- 5
Kepala dan Bahu Terbalik
was formed on 09.05 at 16:00:01 (UTC+0)
signal strength 3 of 5
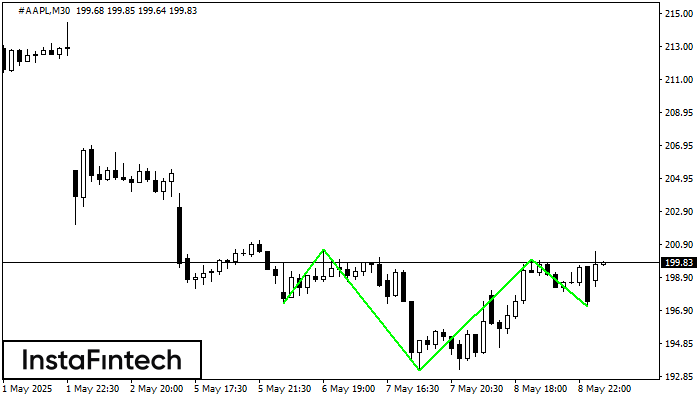
Menurut M30, #AAPL membentuk pola teknikal – Kepala dan Bahu Terbalik. Jika garis leher (Neckline) 200.60/200.00 ditembus, maka instrumen ini kemungkinan akan bergerak menuju 200.30
Open chart in a new window
Kepala dan Bahu Terbalik
was formed on 09.05 at 10:00:01 (UTC+0)
signal strength 3 of 5
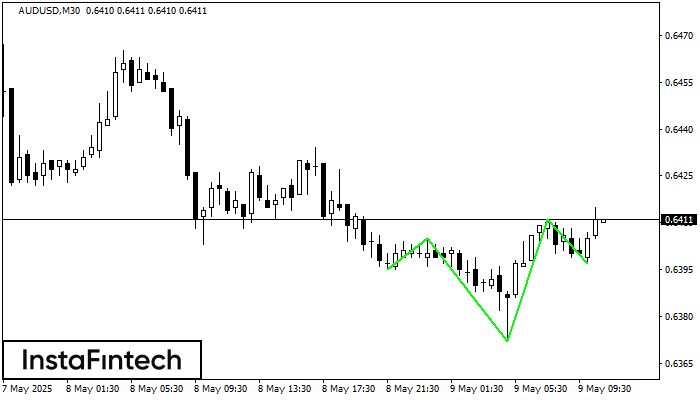
Menurut M30, AUDUSD membentuk pola teknikal – Kepala dan Bahu Terbalik. Jika garis leher (Neckline) 0.6405/0.6411 ditembus, maka instrumen ini kemungkinan akan bergerak menuju 0.6441
Open chart in a new window
Kepala dan Bahu Terbalik
was formed on 09.05 at 08:30:02 (UTC+0)
signal strength 3 of 5
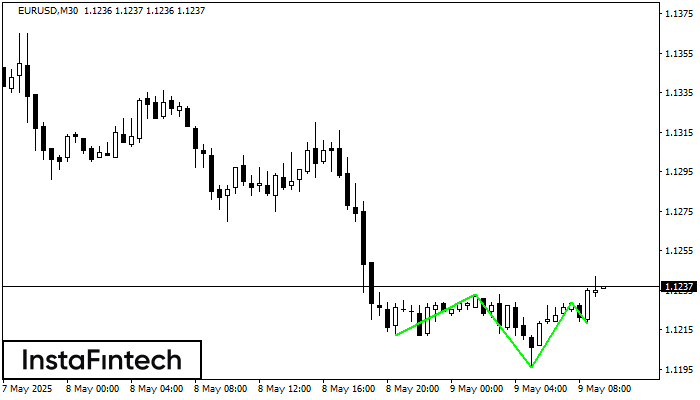
Menurut M30, EURUSD membentuk pola teknikal – Kepala dan Bahu Terbalik. Jika garis leher (Neckline) 1.1233/1.1229 ditembus, maka instrumen ini kemungkinan akan bergerak menuju 1.1259
Open chart in a new window

