

Corak sebenar

Bearish Symmetrical Triangle
was formed on 22.04 at 00:27:05 (UTC+0)
signal strength 3 of 5

According to the chart of M30, USDJPY formed the Bearish Symmetrical Triangle pattern. This pattern signals a further downward trend in case the lower border 140.49 is breached. Here, a hypothetical profit will equal the width of the available pattern that is -61 pips.
- All
- All
- Bearish Rectangle
- Bearish Symmetrical Triangle
- Bearish Symmetrical Triangle
- Bullish Rectangle
- Double Top
- Double Top
- Triple Bottom
- Triple Bottom
- Triple Top
- Triple Top
- All
- All
- Buy
- Sale
- All
- 1
- 2
- 3
- 4
- 5
Double Top
was formed on 02.05 at 16:50:21 (UTC+0)
signal strength 1 of 5
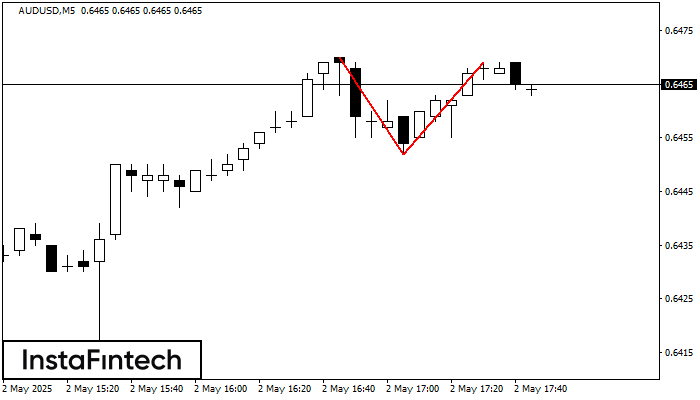
The Double Top reversal pattern has been formed on AUDUSD M5. Characteristics: the upper boundary 0.6470; the lower boundary 0.6452; the width of the pattern is 17 points. Sell trades
The M5 and M15 time frames may have more false entry points.
Open chart in a new window
Bullish Rectangle
was formed on 02.05 at 16:26:31 (UTC+0)
signal strength 1 of 5
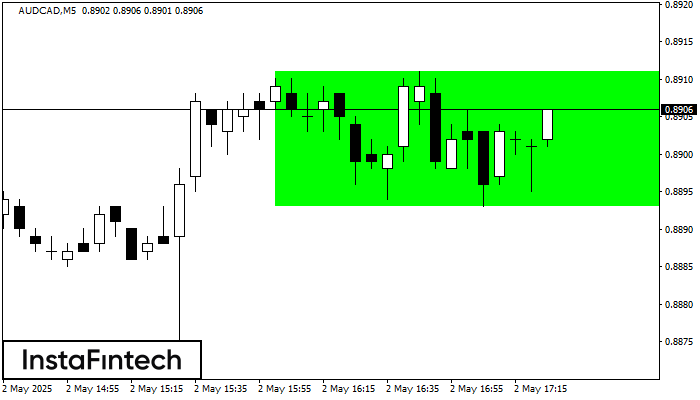
According to the chart of M5, AUDCAD formed the Bullish Rectangle. This type of a pattern indicates a trend continuation. It consists of two levels: resistance 0.8911 and support 0.8893
The M5 and M15 time frames may have more false entry points.
Open chart in a new window
Double Top
was formed on 02.05 at 16:05:28 (UTC+0)
signal strength 1 of 5
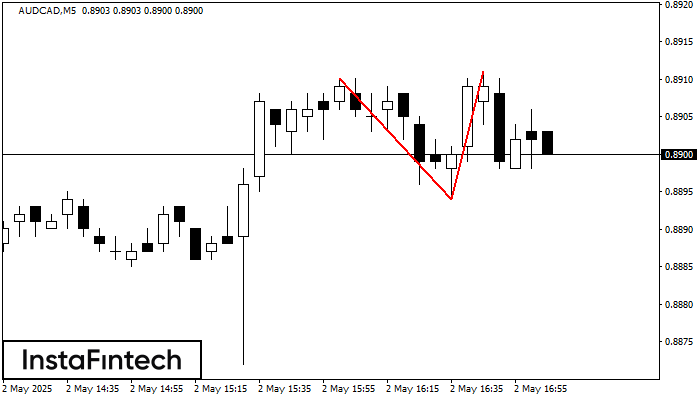
On the chart of AUDCAD M5 the Double Top reversal pattern has been formed. Characteristics: the upper boundary 0.8911; the lower boundary 0.8894; the width of the pattern 17 points
The M5 and M15 time frames may have more false entry points.
Open chart in a new window


