

Corak sebenar

Double Top
was formed on 21.04 at 22:26:30 (UTC+0)
signal strength 1 of 5

The Double Top reversal pattern has been formed on AUDCAD M5. Characteristics: the upper boundary 0.8880; the lower boundary 0.8869; the width of the pattern is 11 points. Sell trades are better to be opened below the lower boundary 0.8869 with a possible movements towards the 0.8854 level.
The M5 and M15 time frames may have more false entry points.
- All
- All
- Bearish Rectangle
- Bearish Symmetrical Triangle
- Bearish Symmetrical Triangle
- Bullish Rectangle
- Double Top
- Double Top
- Triple Bottom
- Triple Bottom
- Triple Top
- Triple Top
- All
- All
- Buy
- Sale
- All
- 1
- 2
- 3
- 4
- 5
Double Top
was formed on 02.05 at 14:30:24 (UTC+0)
signal strength 1 of 5
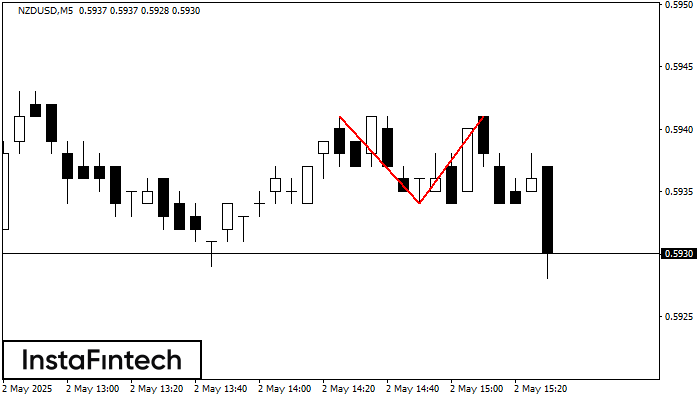
On the chart of NZDUSD M5 the Double Top reversal pattern has been formed. Characteristics: the upper boundary 0.5941; the lower boundary 0.5934; the width of the pattern 7 points
The M5 and M15 time frames may have more false entry points.
Open chart in a new window
Double Bottom
was formed on 02.05 at 14:30:14 (UTC+0)
signal strength 2 of 5
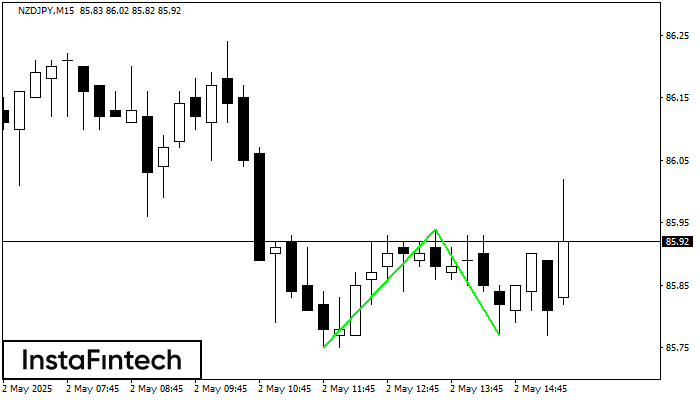
The Double Bottom pattern has been formed on NZDJPY M15. This formation signals a reversal of the trend from downwards to upwards. The signal is that a buy trade should
The M5 and M15 time frames may have more false entry points.
Open chart in a new window
Inverse Head and Shoulder
was formed on 02.05 at 14:30:11 (UTC+0)
signal strength 2 of 5
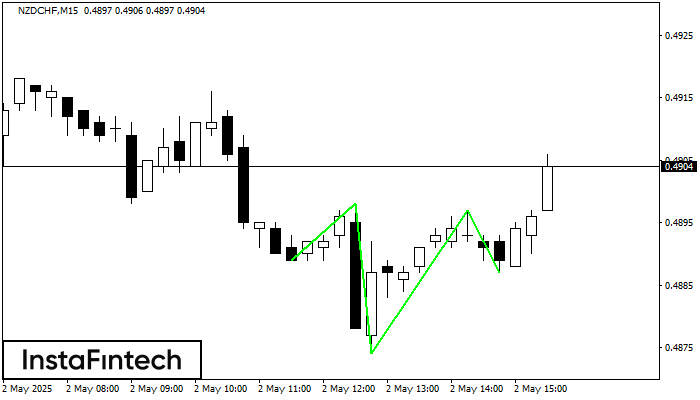
According to M15, NZDCHF is shaping the technical pattern – the Inverse Head and Shoulder. In case the Neckline 0.4898/0.4897 is broken out, the instrument is likely to move toward
The M5 and M15 time frames may have more false entry points.
Open chart in a new window


