

Corak sebenar

Bearish Symmetrical Triangle
was formed on 21.04 at 21:58:31 (UTC+0)
signal strength 1 of 5
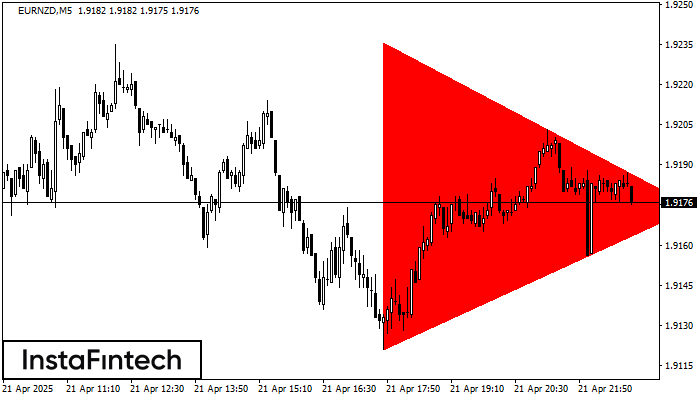
According to the chart of M5, EURNZD formed the Bearish Symmetrical Triangle pattern. Description: The lower border is 1.9121/1.9174 and upper border is 1.9236/1.9174. The pattern width is measured on the chart at -115 pips. The formation of the Bearish Symmetrical Triangle pattern evidently signals a continuation of the downward trend. In other words, if the scenario comes true and EURNZD breaches the lower border, the price could continue its move toward 1.9159.
The M5 and M15 time frames may have more false entry points.
- All
- All
- Bearish Rectangle
- Bearish Symmetrical Triangle
- Bearish Symmetrical Triangle
- Bullish Rectangle
- Double Top
- Double Top
- Triple Bottom
- Triple Bottom
- Triple Top
- Triple Top
- All
- All
- Buy
- Sale
- All
- 1
- 2
- 3
- 4
- 5
Triple Top
was formed on 02.05 at 11:00:30 (UTC+0)
signal strength 4 of 5
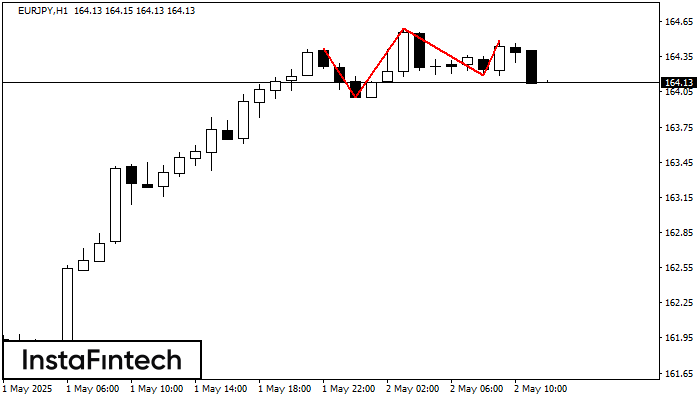
Corak Triple Top telah dibentuk pada carta bagi instrumen dagangan EURJPY H1. Ia adalah corak pembalikan yang memaparkan ciri-ciri berikut: tahap rintangan -7, tahap sokongan -19, dan lebar corak
Open chart in a new window
Triple Top
was formed on 02.05 at 11:00:11 (UTC+0)
signal strength 3 of 5
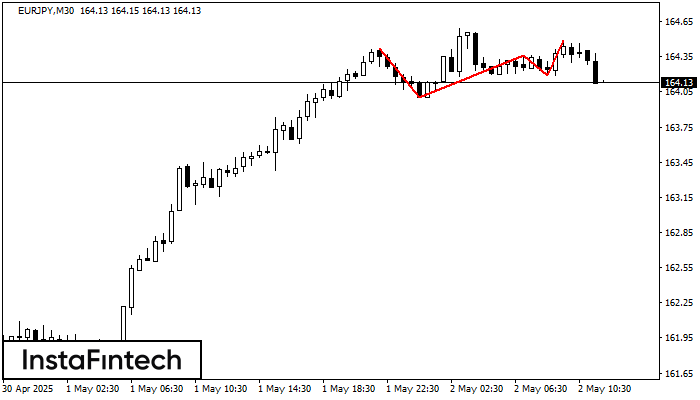
Corak Triple Top telah dibentuk pada carta bagi instrumen dagangan EURJPY M30. Ia adalah corak pembalikan yang memaparkan ciri-ciri berikut: tahap rintangan -7, tahap sokongan -19, dan lebar corak
Open chart in a new window
Double Bottom
was formed on 02.05 at 10:41:00 (UTC+0)
signal strength 1 of 5

Corak Double Bottom telah dibentuk pada EURCHF M5. Ciri-ciri: tahap sokongan 0.9361; tahap rintangan 0.9382; lebar corak 21 mata. Sekiranya tahap rintangan ditembusi, perubahan aliran boleh diramalkan dengan titik sasaran
Carta masa M5 dan M15 mungkin mempunyai lebih banyak titik kemasukan palsu.
Open chart in a new window


