

Corak sebenar

Bullish Rectangle
was formed on 19.04 at 17:03:40 (UTC+0)
signal strength 1 of 5

According to the chart of M5, #Bitcoin formed the Bullish Rectangle. This type of a pattern indicates a trend continuation. It consists of two levels: resistance 85457.12 and support 85308.07. In case the resistance level 85457.12 - 85457.12 is broken, the instrument is likely to follow the bullish trend.
The M5 and M15 time frames may have more false entry points.
- All
- All
- Bearish Rectangle
- Bearish Symmetrical Triangle
- Bearish Symmetrical Triangle
- Bullish Rectangle
- Double Top
- Double Top
- Triple Bottom
- Triple Bottom
- Triple Top
- Triple Top
- All
- All
- Buy
- Sale
- All
- 1
- 2
- 3
- 4
- 5
हेड एण्ड शोल्डर्स
was formed on 02.05 at 15:40:20 (UTC+0)
signal strength 1 of 5
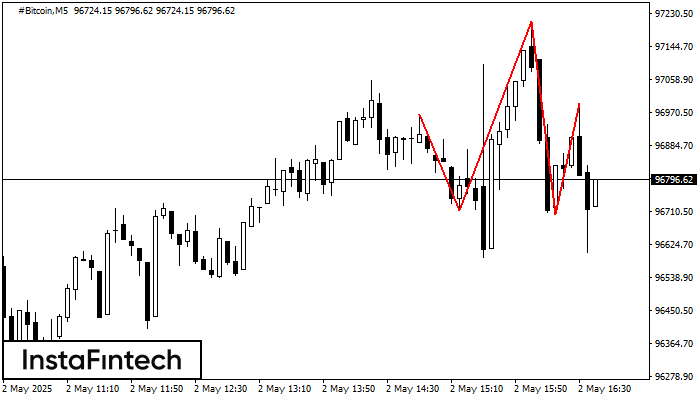
हेड एण्ड शोल्डर्स नामक तकनीकी पैटर्न #Bitcoin M5 के चार्ट पर प्रदर्शित हुआ है। वजनदार कारणों से यह सुझाव दिया जाता है कि दाहिना शोल्डर बनने के बाद कीमत नेकलाइन
M5 और M15 समय सीमा में अधिक फाल्स एंट्री पॉइंट्स हो सकते हैं।
Open chart in a new window
बियरिश पताका
was formed on 02.05 at 14:58:14 (UTC+0)
signal strength 1 of 5
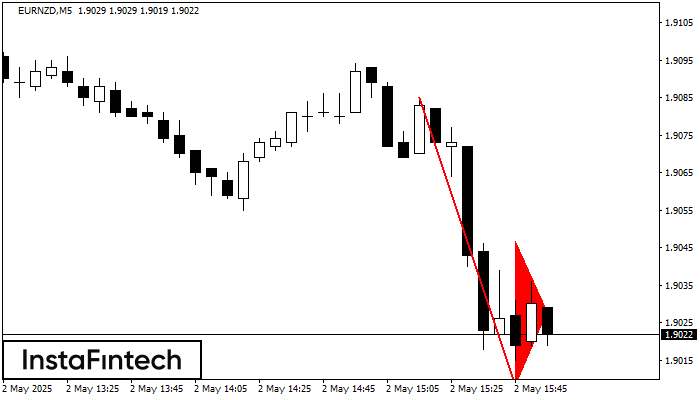
बियरिश पताका पैटर्न EURNZD M5 चार्ट पर बना है। यह मौजूदा ट्रेंड कि संभावित निरंतरता का संकेत देता है। निर्दिष्टीकरण: पैटर्न का नीचल स्तर 1.9008 पर है; फ्लैगपोल की ऊंचाई
M5 और M15 समय सीमा में अधिक फाल्स एंट्री पॉइंट्स हो सकते हैं।
Open chart in a new window
डबल टॉप
was formed on 02.05 at 14:30:24 (UTC+0)
signal strength 1 of 5
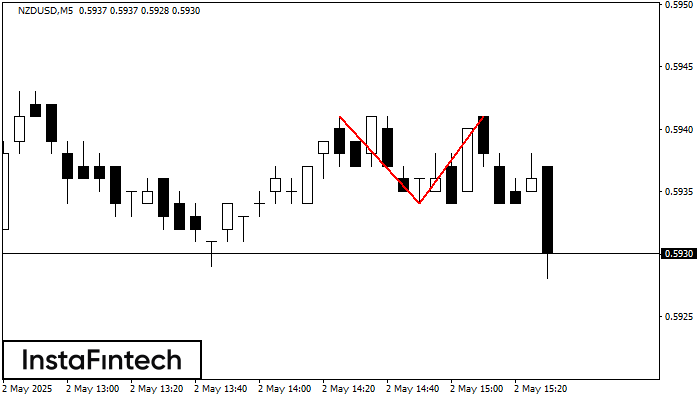
NZDUSD M5 के चार्ट पर डबल टॉप रीवर्सल पैटर्न बना है। विशेषताएं: ऊपरी सीमा 0.5941; निचली सीमा 0.5934; पैटर्न की चौड़ाई 7 पॉइंट्स। संकेत: निचली सीमा के टूटने से 0.5919
M5 और M15 समय सीमा में अधिक फाल्स एंट्री पॉइंट्स हो सकते हैं।
Open chart in a new window


