

Corak sebenar

Double Top
was formed on 16.04 at 10:30:11 (UTC+0)
signal strength 2 of 5
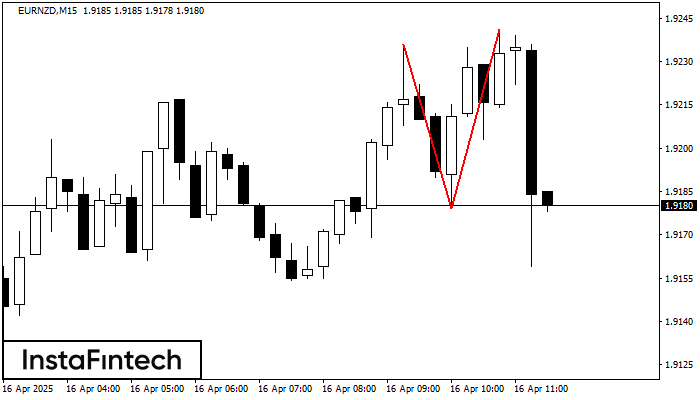
The Double Top reversal pattern has been formed on EURNZD M15. Characteristics: the upper boundary 1.9236; the lower boundary 1.9179; the width of the pattern is 62 points. Sell trades are better to be opened below the lower boundary 1.9179 with a possible movements towards the 1.9157 level.
The M5 and M15 time frames may have more false entry points.
Juga lihat
- All
- All
- Bearish Rectangle
- Bearish Symmetrical Triangle
- Bearish Symmetrical Triangle
- Bullish Rectangle
- Double Top
- Double Top
- Triple Bottom
- Triple Bottom
- Triple Top
- Triple Top
- All
- All
- Buy
- Sale
- All
- 1
- 2
- 3
- 4
- 5
Bullish Symmetrical Triangle
сформирован 06.05 в 20:48:32 (UTC+0)
сила сигнала 2 из 5
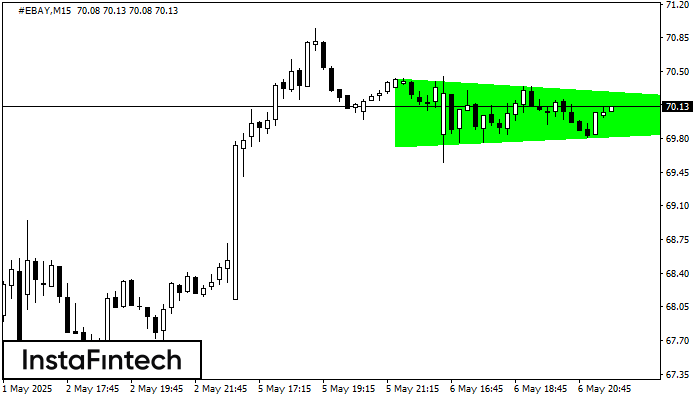
According to the chart of M15, #EBAY formed the Bullish Symmetrical Triangle pattern. The lower border of the pattern touches the coordinates 69.72/70.02 whereas the upper border goes across 70.42/70.02
The M5 and M15 time frames may have more false entry points.
Открыть график инструмента в новом окне
Bearish Flag
сформирован 06.05 в 20:35:36 (UTC+0)
сила сигнала 2 из 5
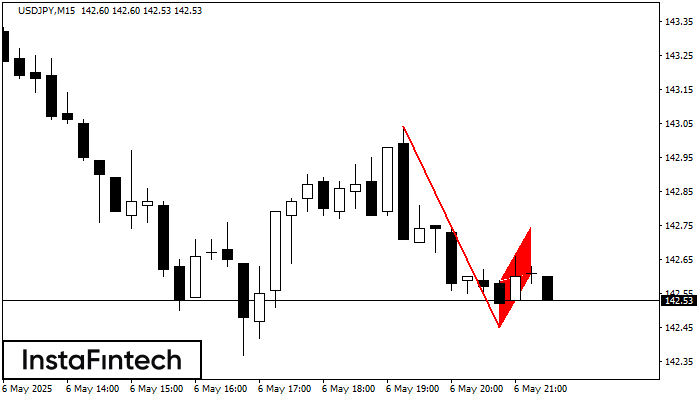
The Bearish Flag pattern has been formed on USDJPY at M15. The lower boundary of the pattern is located at 142.45/142.61 while the upper boundary lies at 142.59/142.75. The projection
The M5 and M15 time frames may have more false entry points.
Открыть график инструмента в новом окне
Bearish pennant
сформирован 06.05 в 20:35:32 (UTC+0)
сила сигнала 2 из 5
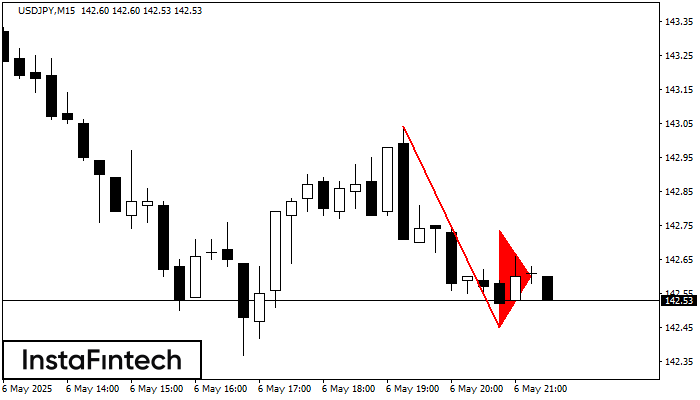
The Bearish pennant pattern has formed on the USDJPY M15 chart. The pattern signals continuation of the downtrend in case the pennant’s low of 142.45 is broken through. Recommendations: Place
The M5 and M15 time frames may have more false entry points.
Открыть график инструмента в новом окне


