

Corak sebenar

Double Bottom
was formed on 16.04 at 08:35:10 (UTC+0)
signal strength 1 of 5
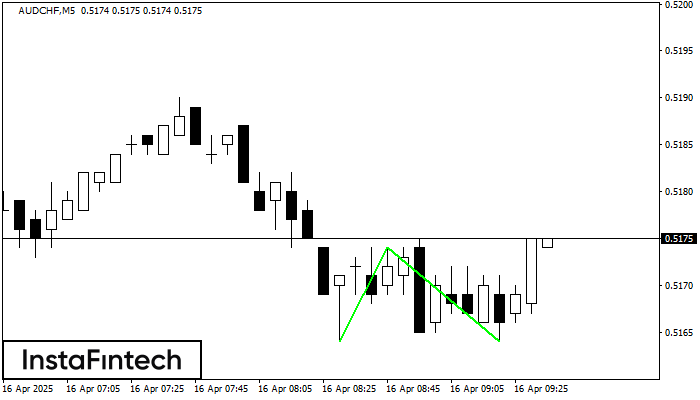
The Double Bottom pattern has been formed on AUDCHF M5. Characteristics: the support level 0.5164; the resistance level 0.5174; the width of the pattern 10 points. If the resistance level is broken, a change in the trend can be predicted with the first target point lying at the distance of 10 points.
The M5 and M15 time frames may have more false entry points.
Juga lihat
- All
- All
- Bearish Rectangle
- Bearish Symmetrical Triangle
- Bearish Symmetrical Triangle
- Bullish Rectangle
- Double Top
- Double Top
- Triple Bottom
- Triple Bottom
- Triple Top
- Triple Top
- All
- All
- Buy
- Sale
- All
- 1
- 2
- 3
- 4
- 5
Bullish Symmetrical Triangle
was formed on 05.05 at 18:05:07 (UTC+0)
signal strength 1 of 5
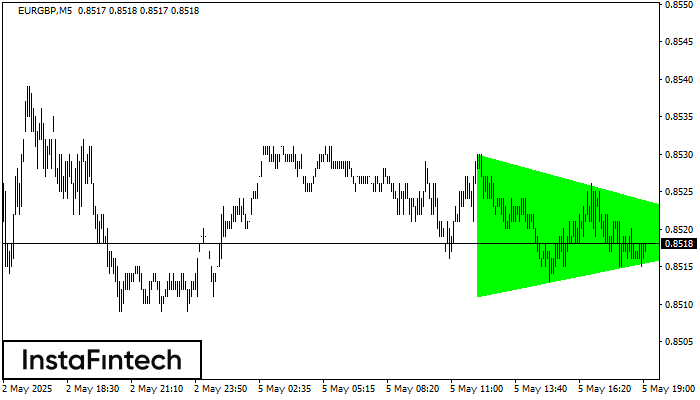
According to the chart of M5, EURGBP formed the Bullish Symmetrical Triangle pattern. The lower border of the pattern touches the coordinates 0.8511/0.8519 whereas the upper border goes across 0.8530/0.8519
The M5 and M15 time frames may have more false entry points.
Open chart in a new window
Double Bottom
was formed on 05.05 at 18:04:57 (UTC+0)
signal strength 1 of 5
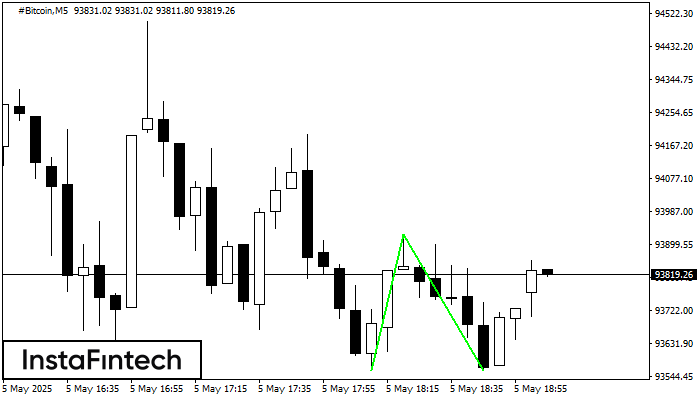
The Double Bottom pattern has been formed on #Bitcoin M5; the upper boundary is 93926.12; the lower boundary is 93560.62. The width of the pattern is 36607 points. In case
The M5 and M15 time frames may have more false entry points.
Open chart in a new window
Double Top
was formed on 05.05 at 18:00:05 (UTC+0)
signal strength 4 of 5
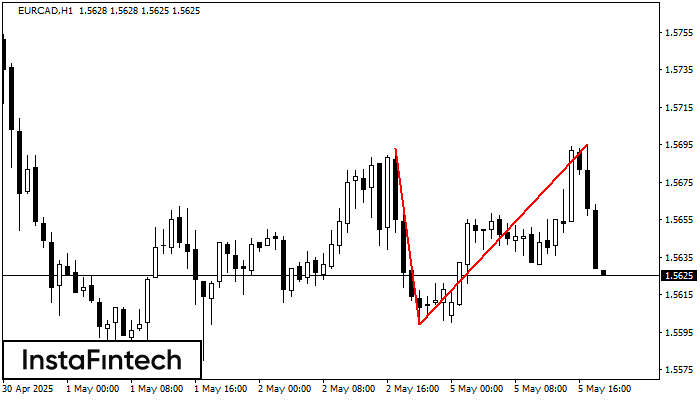
The Double Top reversal pattern has been formed on EURCAD H1. Characteristics: the upper boundary 1.5693; the lower boundary 1.5599; the width of the pattern is 96 points. Sell trades
Open chart in a new window


