

Corak sebenar

Triple Top
was formed on 15.04 at 08:00:07 (UTC+0)
signal strength 3 of 5
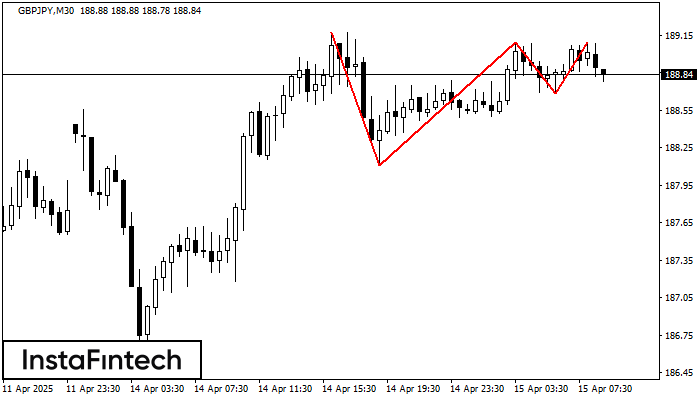
On the chart of the GBPJPY M30 trading instrument, the Triple Top pattern that signals a trend change has formed. It is possible that after formation of the third peak, the price will try to break through the resistance level 188.11, where we advise to open a trading position for sale. Take profit is the projection of the pattern’s width, which is 106 points.
- All
- All
- Bearish Rectangle
- Bearish Symmetrical Triangle
- Bearish Symmetrical Triangle
- Bullish Rectangle
- Double Top
- Double Top
- Triple Bottom
- Triple Bottom
- Triple Top
- Triple Top
- All
- All
- Buy
- Sale
- All
- 1
- 2
- 3
- 4
- 5
Inverse Head and Shoulder
was formed on 09.05 at 16:00:01 (UTC+0)
signal strength 3 of 5
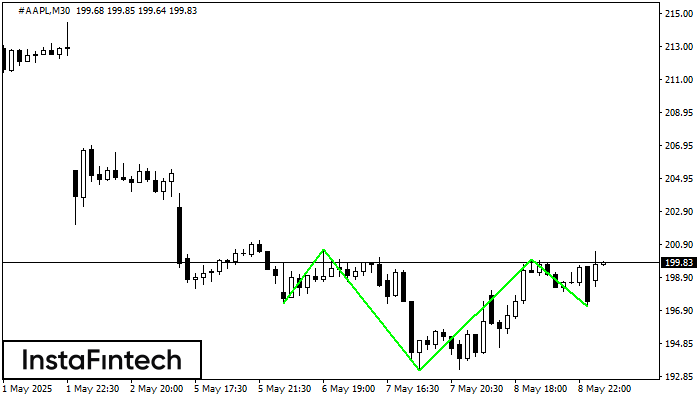
According to M30, #AAPL is shaping the technical pattern – the Inverse Head and Shoulder. In case the Neckline 200.60/200.00 is broken out, the instrument is likely to move toward
Open chart in a new window
Bullish Rectangle
was formed on 09.05 at 15:45:48 (UTC+0)
signal strength 4 of 5
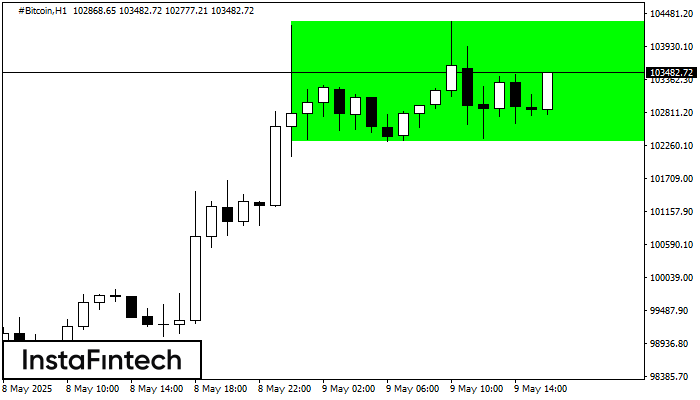
According to the chart of H1, #Bitcoin formed the Bullish Rectangle which is a pattern of a trend continuation. The pattern is contained within the following borders: the lower border
Open chart in a new window
Bullish Rectangle
was formed on 09.05 at 15:02:04 (UTC+0)
signal strength 2 of 5
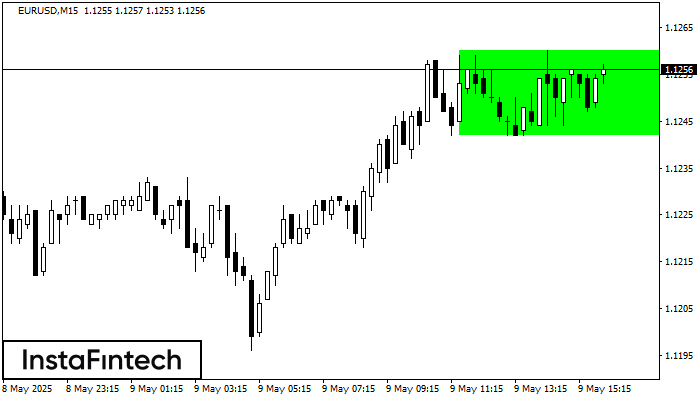
According to the chart of M15, EURUSD formed the Bullish Rectangle. The pattern indicates a trend continuation. The upper border is 1.1260, the lower border is 1.1242. The signal means
The M5 and M15 time frames may have more false entry points.
Open chart in a new window


