

Corak sebenar

Bullish Symmetrical Triangle
was formed on 15.04 at 02:02:47 (UTC+0)
signal strength 4 of 5
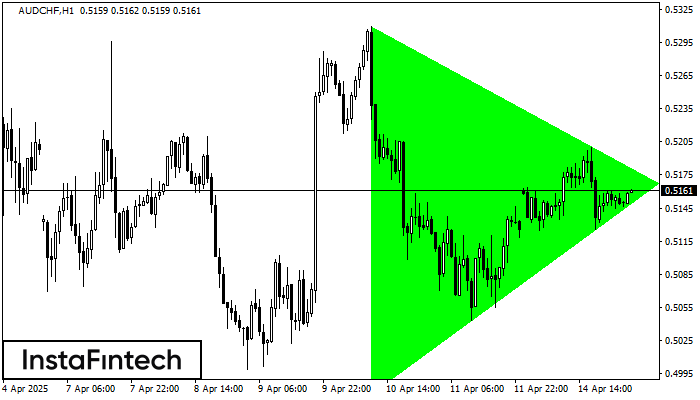
According to the chart of H1, AUDCHF formed the Bullish Symmetrical Triangle pattern. The lower border of the pattern touches the coordinates 0.4976/0.5167 whereas the upper border goes across 0.5310/0.5167. If the Bullish Symmetrical Triangle pattern is in progress, this evidently signals a further upward trend. In other words, in case the scenario comes true, the price of AUDCHF will breach the upper border to head for 0.5207.
Juga lihat
- All
- All
- Bearish Rectangle
- Bearish Symmetrical Triangle
- Bearish Symmetrical Triangle
- Bullish Rectangle
- Double Top
- Double Top
- Triple Bottom
- Triple Bottom
- Triple Top
- Triple Top
- All
- All
- Buy
- Sale
- All
- 1
- 2
- 3
- 4
- 5
Double Bottom
сформирован 06.05 в 06:00:36 (UTC+0)
сила сигнала 2 из 5
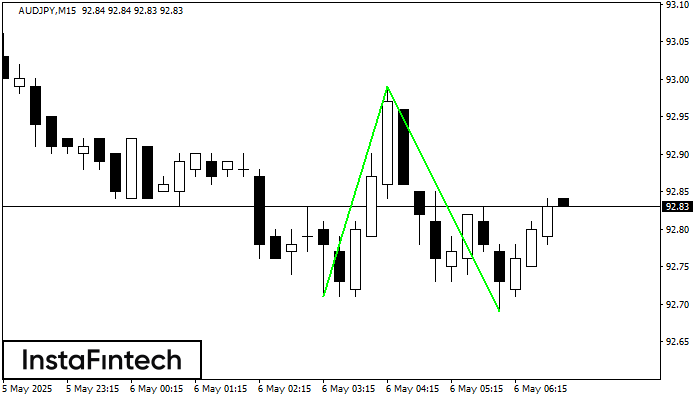
The Double Bottom pattern has been formed on AUDJPY M15. This formation signals a reversal of the trend from downwards to upwards. The signal is that a buy trade should
The M5 and M15 time frames may have more false entry points.
Открыть график инструмента в новом окне
Double Bottom
сформирован 06.05 в 03:45:33 (UTC+0)
сила сигнала 1 из 5
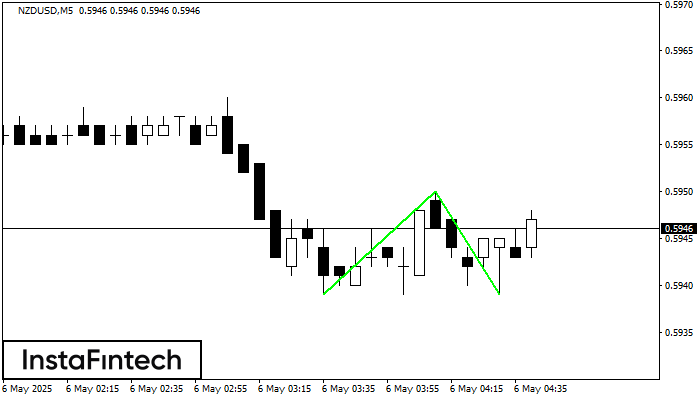
The Double Bottom pattern has been formed on NZDUSD M5; the upper boundary is 0.5950; the lower boundary is 0.5939. The width of the pattern is 11 points. In case
The M5 and M15 time frames may have more false entry points.
Открыть график инструмента в новом окне
Triple Bottom
сформирован 06.05 в 03:00:35 (UTC+0)
сила сигнала 4 из 5

The Triple Bottom pattern has been formed on GBPCHF H1. It has the following characteristics: resistance level 1.0997/1.0988; support level 1.0919/1.0919; the width is 78 points. In the event
Открыть график инструмента в новом окне


