

Corak sebenar

Bullish Symmetrical Triangle
was formed on 15.04 at 00:15:23 (UTC+0)
signal strength 2 of 5
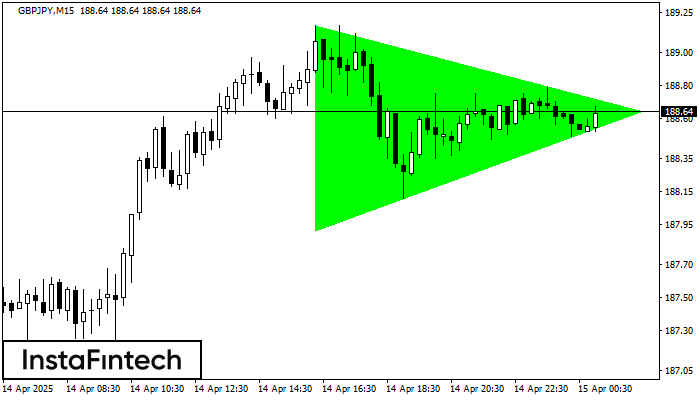
According to the chart of M15, GBPJPY formed the Bullish Symmetrical Triangle pattern. The lower border of the pattern touches the coordinates 187.91/188.64 whereas the upper border goes across 189.17/188.64. If the Bullish Symmetrical Triangle pattern is in progress, this evidently signals a further upward trend. In other words, in case the scenario comes true, the price of GBPJPY will breach the upper border to head for 188.87.
The M5 and M15 time frames may have more false entry points.
Juga lihat
- All
- All
- Bearish Rectangle
- Bearish Symmetrical Triangle
- Bearish Symmetrical Triangle
- Bullish Rectangle
- Double Top
- Double Top
- Triple Bottom
- Triple Bottom
- Triple Top
- Triple Top
- All
- All
- Buy
- Sale
- All
- 1
- 2
- 3
- 4
- 5
Bullish pennant
was formed on 08.05 at 16:10:28 (UTC+0)
signal strength 1 of 5
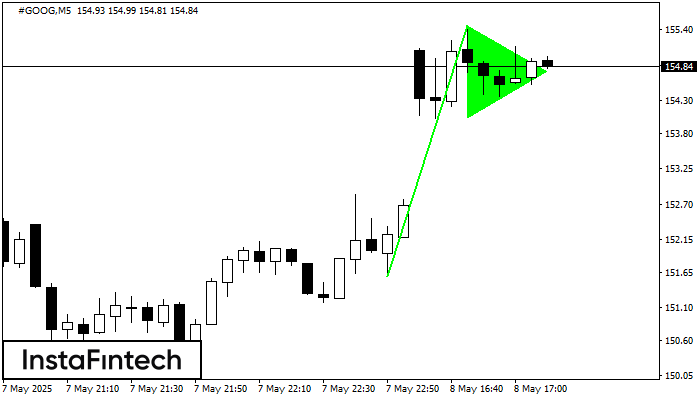
The Bullish pennant graphic pattern has formed on the #GOOG M5 instrument. This pattern type falls under the category of continuation patterns. In this case, if the quote can breaks
The M5 and M15 time frames may have more false entry points.
Open chart in a new window
Double Bottom
was formed on 08.05 at 16:00:26 (UTC+0)
signal strength 4 of 5
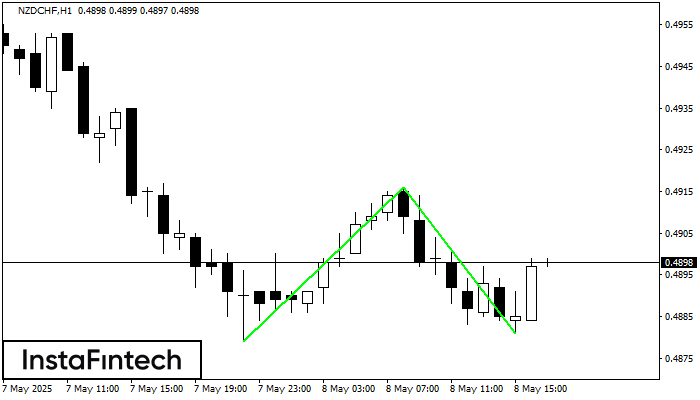
The Double Bottom pattern has been formed on NZDCHF H1. Characteristics: the support level 0.4879; the resistance level 0.4916; the width of the pattern 37 points. If the resistance level
Open chart in a new window
Bullish Symmetrical Triangle
was formed on 08.05 at 15:55:47 (UTC+0)
signal strength 1 of 5
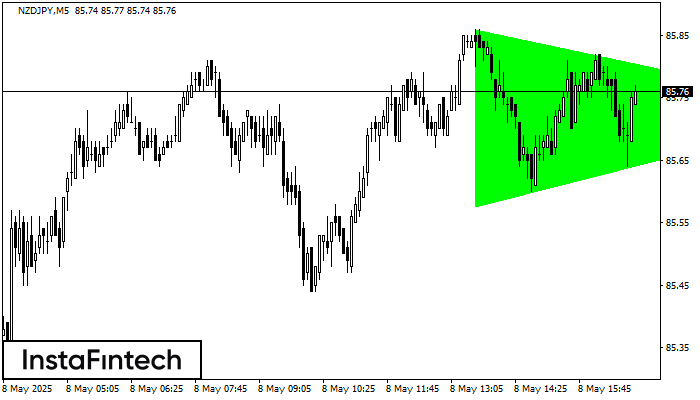
According to the chart of M5, NZDJPY formed the Bullish Symmetrical Triangle pattern. The lower border of the pattern touches the coordinates 85.58/85.73 whereas the upper border goes across 85.86/85.73
The M5 and M15 time frames may have more false entry points.
Open chart in a new window


