

Corak sebenar

Triple Top
was formed on 14.04 at 22:30:39 (UTC+0)
signal strength 3 of 5
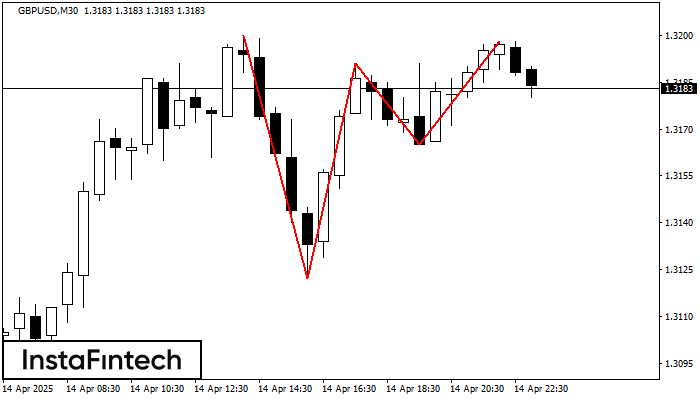
The Triple Top pattern has formed on the chart of the GBPUSD M30 trading instrument. It is a reversal pattern featuring the following characteristics: resistance level 2, support level -43, and pattern’s width 78. Forecast If the price breaks through the support level 1.3122, it is likely to move further down to 1.3161.
Juga lihat
- All
- All
- Bearish Rectangle
- Bearish Symmetrical Triangle
- Bearish Symmetrical Triangle
- Bullish Rectangle
- Double Top
- Double Top
- Triple Bottom
- Triple Bottom
- Triple Top
- Triple Top
- All
- All
- Buy
- Sale
- All
- 1
- 2
- 3
- 4
- 5
Bullish Symmetrical Triangle
was formed on 05.05 at 14:15:38 (UTC+0)
signal strength 1 of 5
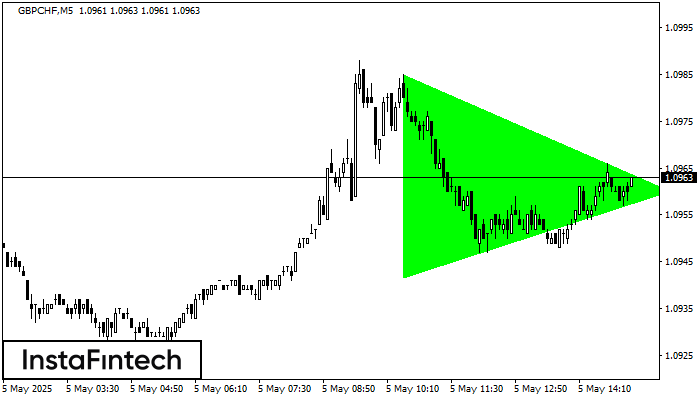
According to the chart of M5, GBPCHF formed the Bullish Symmetrical Triangle pattern, which signals the trend will continue. Description. The upper border of the pattern touches the coordinates 1.0985/1.0960
The M5 and M15 time frames may have more false entry points.
Open chart in a new window
Double Top
was formed on 05.05 at 14:09:45 (UTC+0)
signal strength 1 of 5
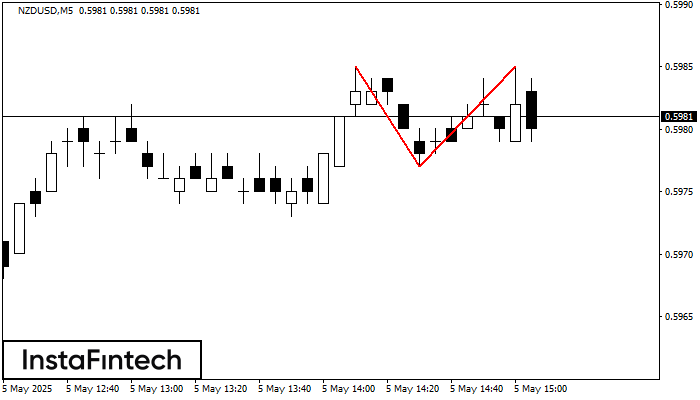
On the chart of NZDUSD M5 the Double Top reversal pattern has been formed. Characteristics: the upper boundary 0.5985; the lower boundary 0.5977; the width of the pattern 8 points
The M5 and M15 time frames may have more false entry points.
Open chart in a new window
Bullish Rectangle
was formed on 05.05 at 14:01:01 (UTC+0)
signal strength 1 of 5
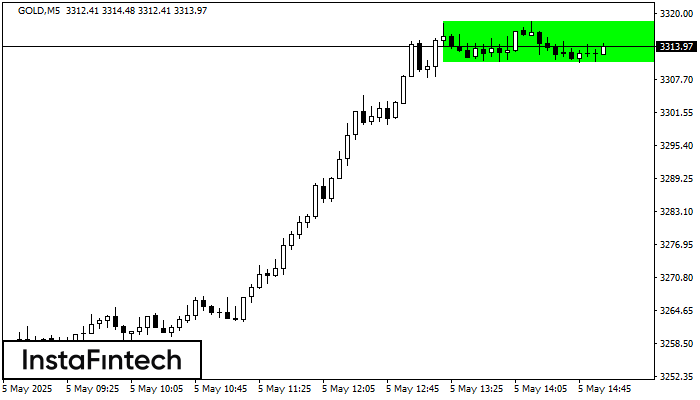
According to the chart of M5, GOLD formed the Bullish Rectangle which is a pattern of a trend continuation. The pattern is contained within the following borders: the lower border
The M5 and M15 time frames may have more false entry points.
Open chart in a new window


