

Corak sebenar

Double Bottom
was formed on 08.04 at 00:00:11 (UTC+0)
signal strength 4 of 5
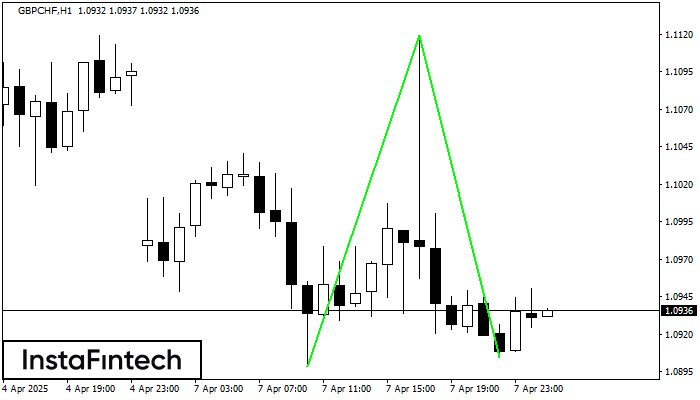
The Double Bottom pattern has been formed on GBPCHF H1; the upper boundary is 1.1119; the lower boundary is 1.0904. The width of the pattern is 221 points. In case of a break of the upper boundary 1.1119, a change in the trend can be predicted where the width of the pattern will coincide with the distance to a possible take profit level.
Juga lihat
- All
- All
- Bearish Rectangle
- Bearish Symmetrical Triangle
- Bearish Symmetrical Triangle
- Bullish Rectangle
- Double Top
- Double Top
- Triple Bottom
- Triple Bottom
- Triple Top
- Triple Top
- All
- All
- Buy
- Sale
- All
- 1
- 2
- 3
- 4
- 5
ट्रिपल बॉटम
was formed on 20.04 at 23:32:42 (UTC+0)
signal strength 3 of 5

ट्रिपल बॉटम पैटर्न AUDCHF M30 के चार्ट पर बना है। पैटर्न की विशेषताएं: पैटर्न की निचली रेखा 0.5232 पर है जिसकी ऊपरी सीमा 0.5232/0.5218 है, प्रक्षेपण की चौड़ाई 26 पॉइंट्स
Open chart in a new window
डबल टॉप
was formed on 20.04 at 23:10:07 (UTC+0)
signal strength 1 of 5

#Bitcoin M5 पर डबल टॉप रीवर्सल पैटर्न बना है। विशेषताएं: ऊपरी सीमा 85197.81; निचली सीमा 84993.66; पैटर्न की चौड़ाई 23229 पॉइंट्स है। सेल ट्रेडों को 84993.66 की निचली सीमा के
M5 और M15 समय सीमा में अधिक फाल्स एंट्री पॉइंट्स हो सकते हैं।
Open chart in a new window
बियरिश आयत
was formed on 20.04 at 19:17:25 (UTC+0)
signal strength 1 of 5

M5 के चार्ट के अनुसार, #Bitcoin से बियरिश आयत बना जो प्रवृत्ति निरंतरता का पैटर्न है। पैटर्न निम्न सीमाओं के भीतर समाहित है: निचली सीमा 84213.45 – 84213.45 और ऊपरी
M5 और M15 समय सीमा में अधिक फाल्स एंट्री पॉइंट्स हो सकते हैं।
Open chart in a new window


