

Corak sebenar

Triple Top
was formed on 07.04 at 06:30:25 (UTC+0)
signal strength 1 of 5
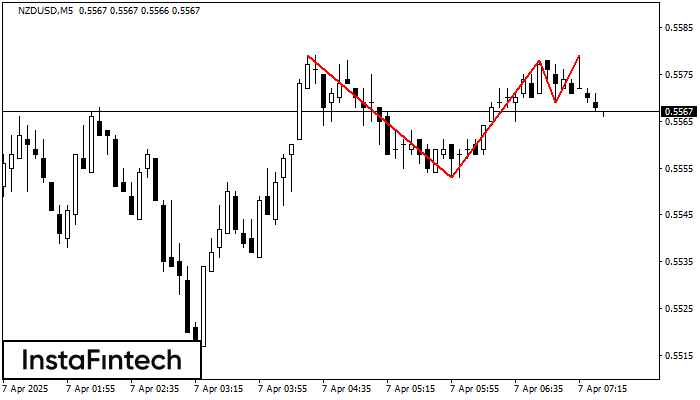
The Triple Top pattern has formed on the chart of the NZDUSD M5. Features of the pattern: borders have an ascending angle; the lower line of the pattern has the coordinates 0.5553/0.5569 with the upper limit 0.5579/0.5579; the projection of the width is 26 points. The formation of the Triple Top figure most likely indicates a change in the trend from upward to downward. This means that in the event of a breakdown of the support level of 0.5553, the price is most likely to continue the downward movement.
The M5 and M15 time frames may have more false entry points.
Juga lihat
- All
- All
- Bearish Rectangle
- Bearish Symmetrical Triangle
- Bearish Symmetrical Triangle
- Bullish Rectangle
- Double Top
- Double Top
- Triple Bottom
- Triple Bottom
- Triple Top
- Triple Top
- All
- All
- Buy
- Sale
- All
- 1
- 2
- 3
- 4
- 5
Triple Bottom
was formed on 05.05 at 15:34:54 (UTC+0)
signal strength 1 of 5
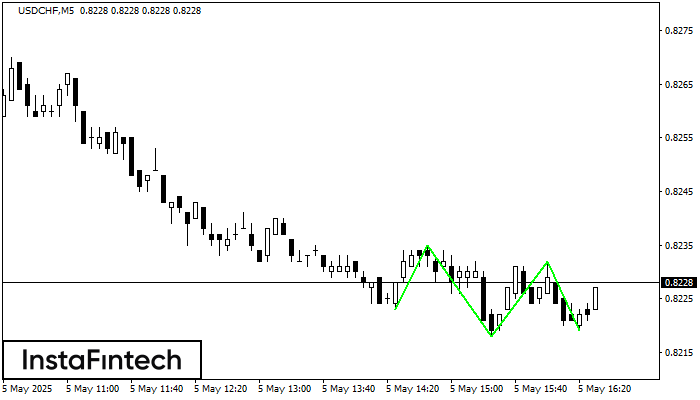
Corak Triple Bottom telah dibentuk pada USDCHF M5. Ia mempunyai ciri-ciri berikut: tahap rintangan 0.8235/0.8232; tahap sokongan 0.8223/0.8219; lebar corak adalah 12 mata. Dalam situasi penembusan paras rintangan 0.8235, harga
Carta masa M5 dan M15 mungkin mempunyai lebih banyak titik kemasukan palsu.
Open chart in a new window
Pennant Aliran Menurun
was formed on 05.05 at 15:32:00 (UTC+0)
signal strength 3 of 5
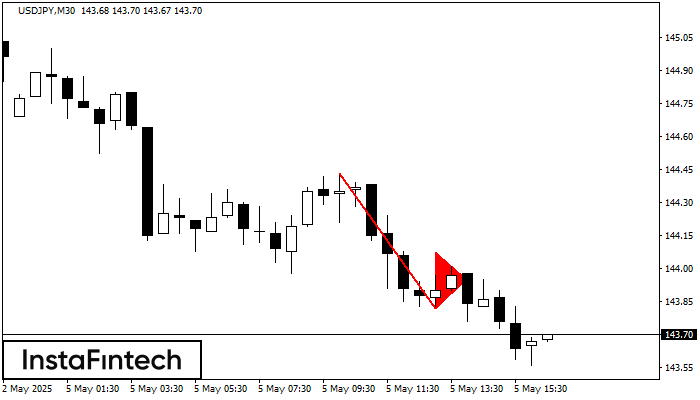
Corak Pennant Aliran Menurun telah dibentuk pada carta USDJPY M30. Corak menandakan kesinambungan aliran menurun sekiranya aliran pennant rendah 143.82 ditembusi. Cadangan: Meletakkan pesanan penanguhan sell stop
Open chart in a new window
Double Top
was formed on 05.05 at 14:24:52 (UTC+0)
signal strength 1 of 5
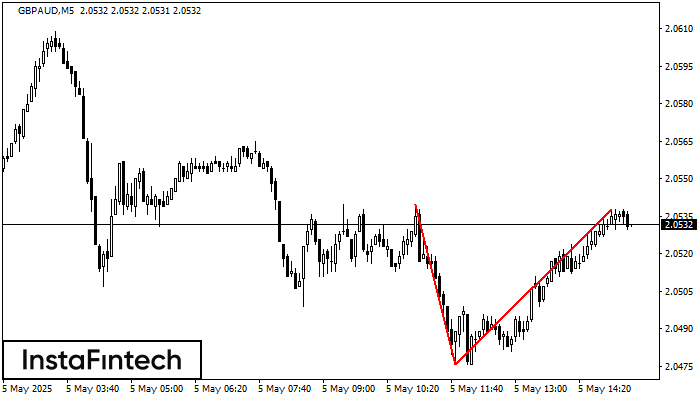
Pada carta GBPAUD M5 corak pembalikan Double Top telah terbentuk. Ciri-ciri: sempadan atas 2.0538; sempadan bawah 2.0476; lebar corak 62 mata. Isyarat: penembusan sempadan bawah akan menyebabkan kesinambungan arah aliran
Carta masa M5 dan M15 mungkin mempunyai lebih banyak titik kemasukan palsu.
Open chart in a new window


