

Corak sebenar

Bearish Rectangle
was formed on 06.04 at 23:00:12 (UTC+0)
signal strength 2 of 5
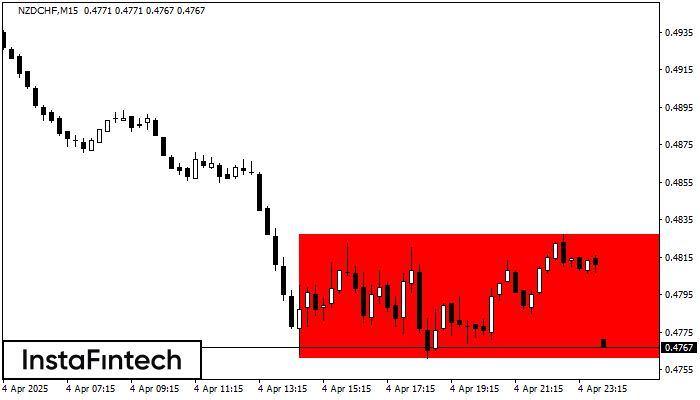
According to the chart of M15, NZDCHF formed the Bearish Rectangle. The pattern indicates a trend continuation. The upper border is 0.4827, the lower border is 0.4761. The signal means that a short position should be opened after fixing a price below the lower border 0.4761 of the Bearish Rectangle.
The M5 and M15 time frames may have more false entry points.
- All
- All
- Bearish Rectangle
- Bearish Symmetrical Triangle
- Bearish Symmetrical Triangle
- Bullish Rectangle
- Double Top
- Double Top
- Triple Bottom
- Triple Bottom
- Triple Top
- Triple Top
- All
- All
- Buy
- Sale
- All
- 1
- 2
- 3
- 4
- 5
Double Top
сформирован 05.05 в 13:35:02 (UTC+0)
сила сигнала 1 из 5
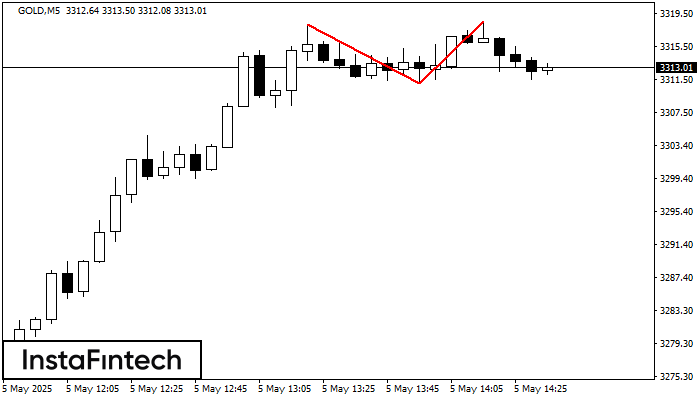
The Double Top reversal pattern has been formed on GOLD M5. Characteristics: the upper boundary 3318.18; the lower boundary 3311.06; the width of the pattern is 746 points. Sell trades
The M5 and M15 time frames may have more false entry points.
Открыть график инструмента в новом окне
Double Bottom
сформирован 05.05 в 13:00:02 (UTC+0)
сила сигнала 2 из 5
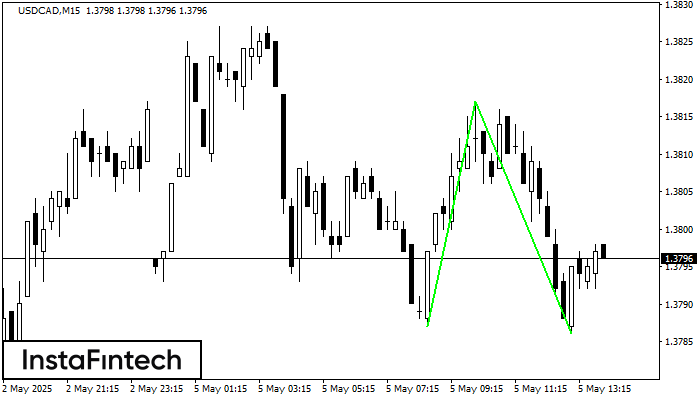
The Double Bottom pattern has been formed on USDCAD M15; the upper boundary is 1.3817; the lower boundary is 1.3786. The width of the pattern is 30 points. In case
The M5 and M15 time frames may have more false entry points.
Открыть график инструмента в новом окне
Double Bottom
сформирован 05.05 в 12:20:14 (UTC+0)
сила сигнала 1 из 5
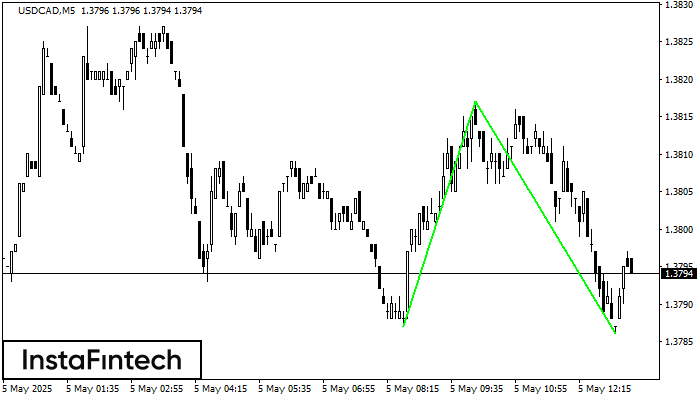
The Double Bottom pattern has been formed on USDCAD M5; the upper boundary is 1.3817; the lower boundary is 1.3786. The width of the pattern is 30 points. In case
The M5 and M15 time frames may have more false entry points.
Открыть график инструмента в новом окне


