

Corak sebenar

Bearish Flag
was formed on 04.04 at 17:33:28 (UTC+0)
signal strength 2 of 5

The Bearish Flag pattern has been formed on the chart #TSLA M15 which signals that the downward trend will continue. If the price breaks below the low at 235.81, then it is most likely to move further downwards. The price will likely move by the number of points which equals the length of the flag pole (15 points).
The M5 and M15 time frames may have more false entry points.
- All
- All
- Bearish Rectangle
- Bearish Symmetrical Triangle
- Bearish Symmetrical Triangle
- Bullish Rectangle
- Double Top
- Double Top
- Triple Bottom
- Triple Bottom
- Triple Top
- Triple Top
- All
- All
- Buy
- Sale
- All
- 1
- 2
- 3
- 4
- 5
Double Bottom
was formed on 07.05 at 22:31:29 (UTC+0)
signal strength 1 of 5
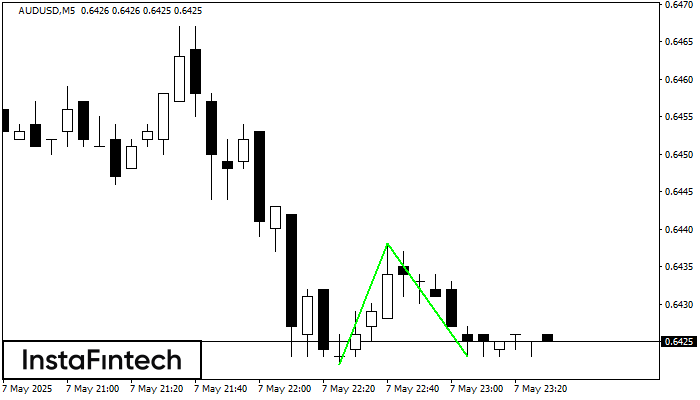
Corak Double Bottom telah dibentuk pada AUDUSD M5. Ciri-ciri: tahap sokongan 0.6422; tahap rintangan 0.6438; lebar corak 16 mata. Sekiranya tahap rintangan ditembusi, perubahan aliran boleh diramalkan dengan titik sasaran
Carta masa M5 dan M15 mungkin mempunyai lebih banyak titik kemasukan palsu.
Open chart in a new window
Double Bottom
was formed on 07.05 at 21:45:30 (UTC+0)
signal strength 1 of 5
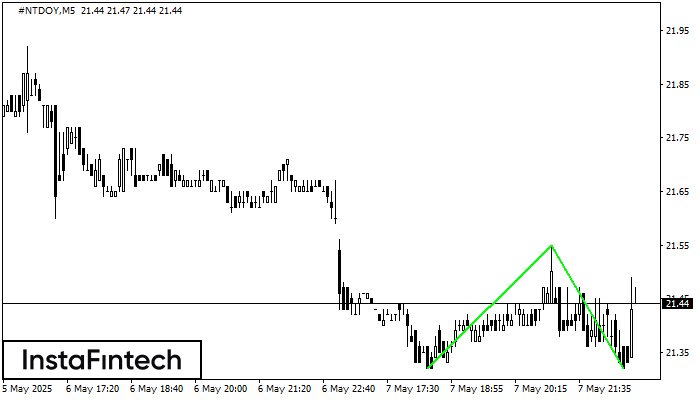
Corak Double Bottom telah dibentuk pada #NTDOY M5. Ciri-ciri: tahap sokongan 21.32; tahap rintangan 21.55; lebar corak 23 mata. Sekiranya tahap rintangan ditembusi, perubahan aliran boleh diramalkan dengan titik sasaran
Carta masa M5 dan M15 mungkin mempunyai lebih banyak titik kemasukan palsu.
Open chart in a new window
Double Bottom
was formed on 07.05 at 21:45:28 (UTC+0)
signal strength 1 of 5
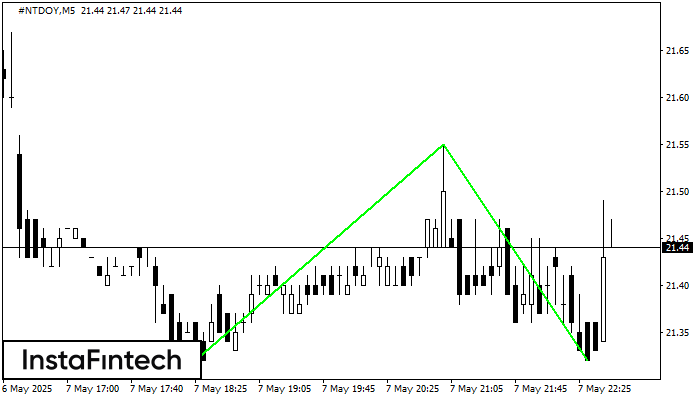
Corak Double Bottom telah dibentuk pada #NTDOY M5. Pembentukan ini menandakan pembalikan aliran dari aliran menurun ke atas. Isyarat ialah perdagangan membeli harus dibuka selepas sempadan atas corak 21.55 telah
Carta masa M5 dan M15 mungkin mempunyai lebih banyak titik kemasukan palsu.
Open chart in a new window


