

Corak sebenar

Bearish pennant
was formed on 04.04 at 03:26:03 (UTC+0)
signal strength 1 of 5

The Bearish pennant pattern has formed on the AUDCAD M5 chart. It signals potential continuation of the existing trend. Specifications: the pattern’s bottom has the coordinate of 0.8881; the projection of the flagpole height is equal to 21 pips. In case the price breaks out the pattern’s bottom of 0.8881, the downtrend is expected to continue for further level 0.8866.
The M5 and M15 time frames may have more false entry points.
Juga lihat
- All
- All
- Bearish Rectangle
- Bearish Symmetrical Triangle
- Bearish Symmetrical Triangle
- Bullish Rectangle
- Double Top
- Double Top
- Triple Bottom
- Triple Bottom
- Triple Top
- Triple Top
- All
- All
- Buy
- Sale
- All
- 1
- 2
- 3
- 4
- 5
Triple Top
was formed on 09.04 at 23:00:06 (UTC+0)
signal strength 1 of 5
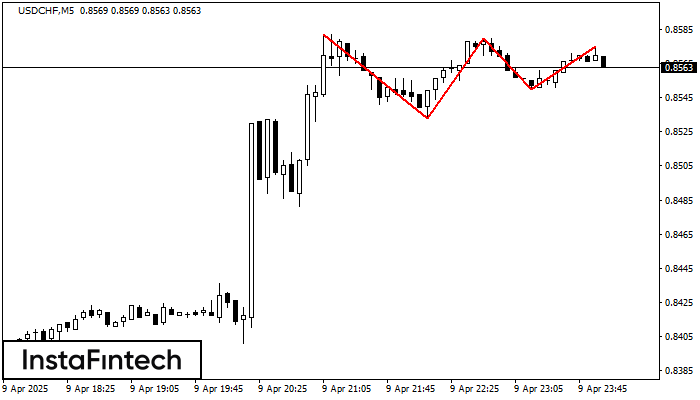
Corak Triple Top telah dibentuk pada carta USDCHF M5. Ciri corak: sempadan mempunyai sudut menaik; garisan bawah corak mempunyai koordinat 0.8533/0.8550 dengan had atas 0.8582/0.8575; unjuran lebar ialah 49 mata
Carta masa M5 dan M15 mungkin mempunyai lebih banyak titik kemasukan palsu.
Open chart in a new window
Triple Bottom
was formed on 09.04 at 22:55:27 (UTC+0)
signal strength 1 of 5
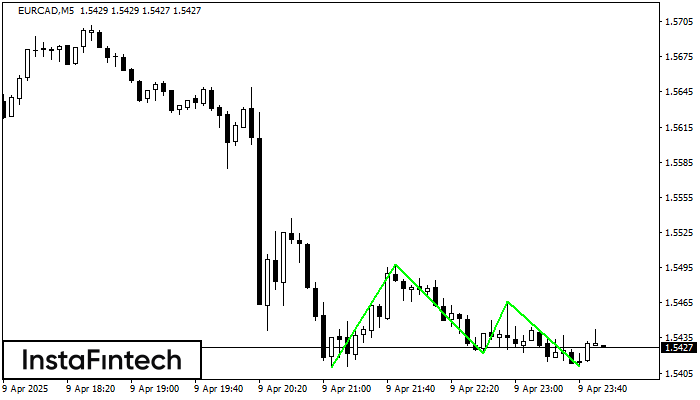
Corak Triple Bottom telah dibentuk pada EURCAD M5. Ia mempunyai ciri-ciri berikut: tahap rintangan 1.5498/1.5466; tahap sokongan 1.5410/1.5411; lebar corak adalah 88 mata. Dalam situasi penembusan paras rintangan 1.5498, harga
Carta masa M5 dan M15 mungkin mempunyai lebih banyak titik kemasukan palsu.
Open chart in a new window
Segi Empat Menaik
was formed on 09.04 at 22:50:23 (UTC+0)
signal strength 1 of 5
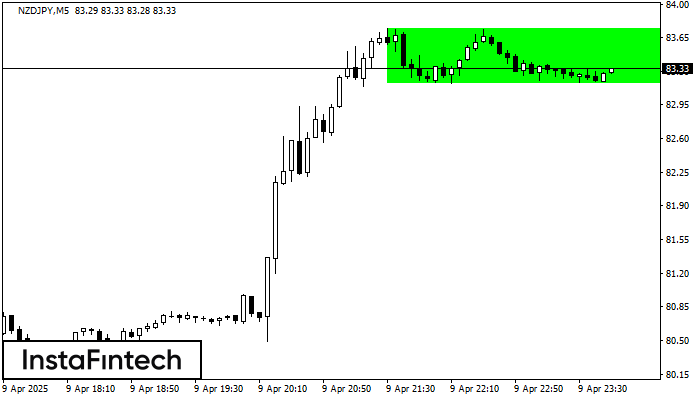
Berdasarkan carta M5, NZDJPY telah membentuk Segi Empat Menaik. Corak ini menunjukkan kesinambungan aliran. Sempadan atas adalah 83.75, sempadan bawah adalah 83.17. Isyarat bermakna bahawa kedudukan panjang perlu dibuka
Carta masa M5 dan M15 mungkin mempunyai lebih banyak titik kemasukan palsu.
Open chart in a new window


