

Corak sebenar

Inverse Head and Shoulder
was formed on 03.04 at 08:29:59 (UTC+0)
signal strength 2 of 5
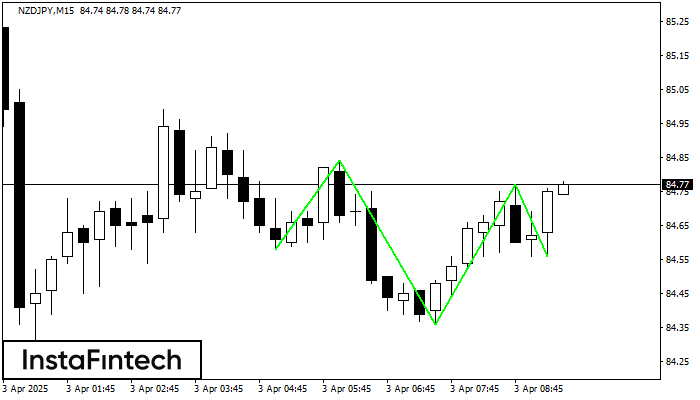
According to the chart of M15, NZDJPY formed the Inverse Head and Shoulder pattern. The Head’s top is set at 84.77 while the median line of the Neck is found at 84.36/84.56. The formation of the Inverse Head and Shoulder pattern evidently signals a reversal of the downward trend. In other words, in case the scenario comes true, the price of NZDJPY will go towards 85.00
The M5 and M15 time frames may have more false entry points.
- All
- All
- Bearish Rectangle
- Bearish Symmetrical Triangle
- Bearish Symmetrical Triangle
- Bullish Rectangle
- Double Top
- Double Top
- Triple Bottom
- Triple Bottom
- Triple Top
- Triple Top
- All
- All
- Buy
- Sale
- All
- 1
- 2
- 3
- 4
- 5
Bawah Triple
was formed on 21.04 at 19:00:13 (UTC+0)
signal strength 1 of 5
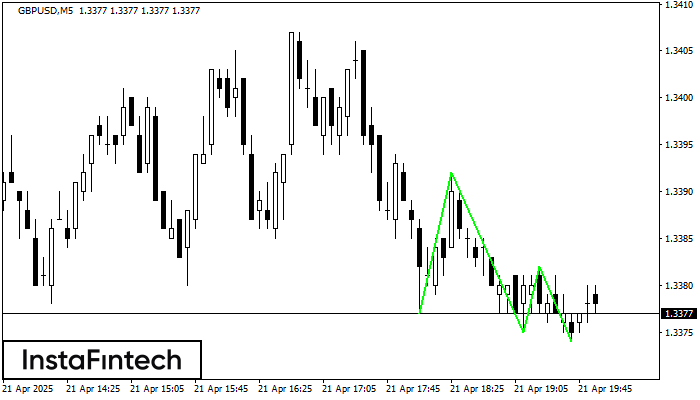
Pola Bawah Triple telah terbentuk pada GBPUSD M5. Pola tersebut memiliki karakteristik sebagai berikut: level resistance 1.3392/1.3382; level support 1.3377/1.3374; dengan lebar 15 poin. Jika terjadi pemecahan (breakdown) pada level
Rangka waktu M5 dan M15 mungkin memiliki lebih dari titik entri yang keliru.
Open chart in a new window
Bawah Triple
was formed on 21.04 at 18:40:14 (UTC+0)
signal strength 1 of 5

Pola Bawah Triple telah terbentuk pada grafik instrumen trading #AMZN M5. Pola tersebut menandakan perubahan dalam trend dari menurun menjadi naik jika terjadi pemecahan (breakdown) 167.53/167.17
Rangka waktu M5 dan M15 mungkin memiliki lebih dari titik entri yang keliru.
Open chart in a new window
Bawah Ganda
was formed on 21.04 at 18:15:42 (UTC+0)
signal strength 2 of 5
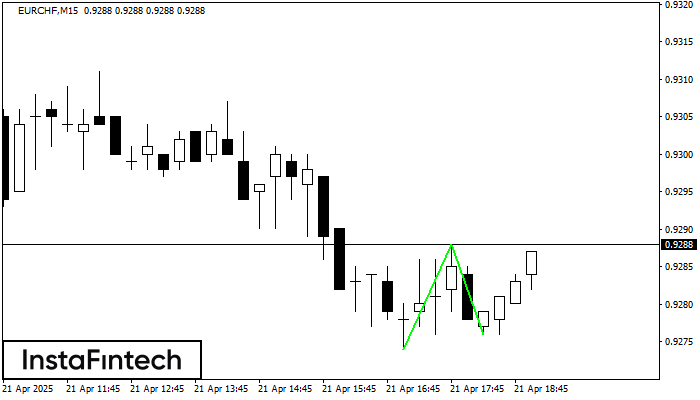
Pola Bawah Ganda telah terbentuk pada EURCHF M15. Formasi ini mensinyalkan reversal tren dari arah penurunan ke arah kenaikan. Sinyal menunjukkan bahwa transaksi beli harus dibuka setelah batas atas pola
Rangka waktu M5 dan M15 mungkin memiliki lebih dari titik entri yang keliru.
Open chart in a new window


