

Corak sebenar

Double Bottom
was formed on 03.04 at 08:29:56 (UTC+0)
signal strength 3 of 5
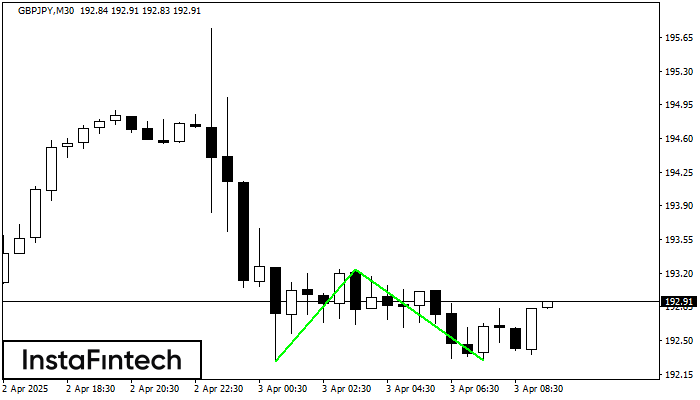
The Double Bottom pattern has been formed on GBPJPY M30; the upper boundary is 193.24; the lower boundary is 192.29. The width of the pattern is 96 points. In case of a break of the upper boundary 193.24, a change in the trend can be predicted where the width of the pattern will coincide with the distance to a possible take profit level.
- All
- All
- Bearish Rectangle
- Bearish Symmetrical Triangle
- Bearish Symmetrical Triangle
- Bullish Rectangle
- Double Top
- Double Top
- Triple Bottom
- Triple Bottom
- Triple Top
- Triple Top
- All
- All
- Buy
- Sale
- All
- 1
- 2
- 3
- 4
- 5
Bearish Symmetrical Triangle
was formed on 25.04 at 02:17:26 (UTC+0)
signal strength 2 of 5
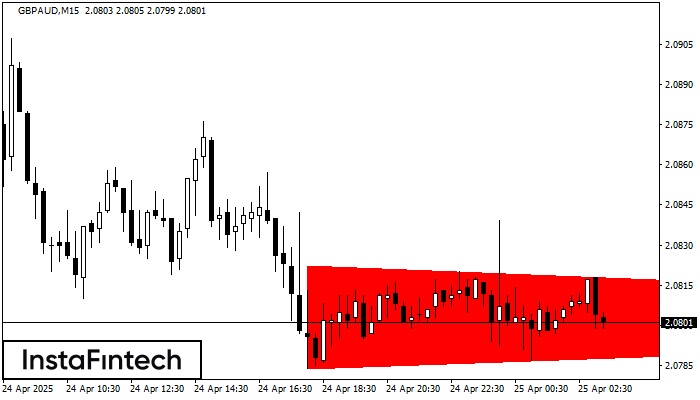
According to the chart of M15, GBPAUD formed the Bearish Symmetrical Triangle pattern. Description: The lower border is 2.0784/2.0802 and upper border is 2.0822/2.0802. The pattern width is measured
The M5 and M15 time frames may have more false entry points.
Open chart in a new window
Double Bottom
was formed on 25.04 at 01:59:57 (UTC+0)
signal strength 3 of 5
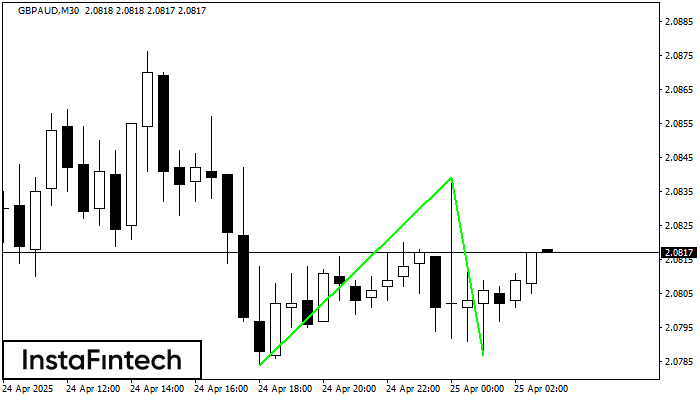
The Double Bottom pattern has been formed on GBPAUD M30. Characteristics: the support level 2.0784; the resistance level 2.0839; the width of the pattern 55 points. If the resistance level
Open chart in a new window
Double Top
was formed on 25.04 at 01:45:13 (UTC+0)
signal strength 2 of 5
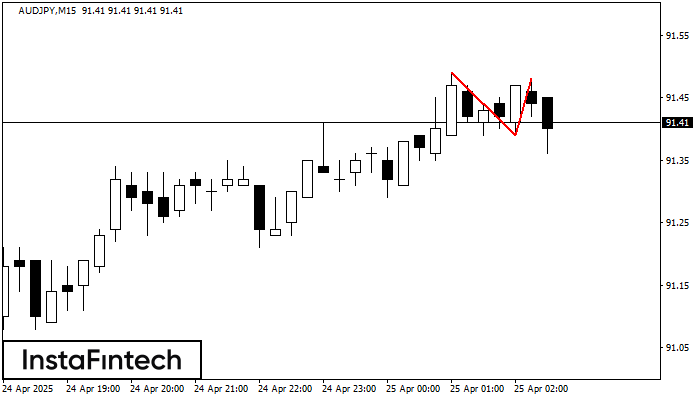
On the chart of AUDJPY M15 the Double Top reversal pattern has been formed. Characteristics: the upper boundary 91.48; the lower boundary 91.39; the width of the pattern 9 points
The M5 and M15 time frames may have more false entry points.
Open chart in a new window


