

Corak sebenar

Double Top
was formed on 03.04 at 05:15:16 (UTC+0)
signal strength 2 of 5
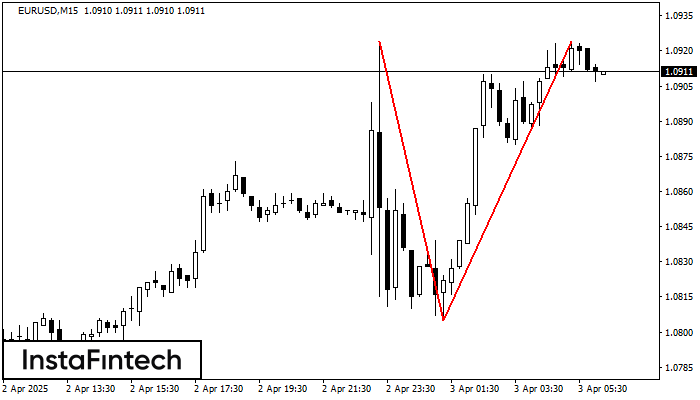
The Double Top reversal pattern has been formed on EURUSD M15. Characteristics: the upper boundary 1.0924; the lower boundary 1.0805; the width of the pattern is 119 points. Sell trades are better to be opened below the lower boundary 1.0805 with a possible movements towards the 1.0783 level.
The M5 and M15 time frames may have more false entry points.
Juga lihat
- All
- All
- Bearish Rectangle
- Bearish Symmetrical Triangle
- Bearish Symmetrical Triangle
- Bullish Rectangle
- Double Top
- Double Top
- Triple Bottom
- Triple Bottom
- Triple Top
- Triple Top
- All
- All
- Buy
- Sale
- All
- 1
- 2
- 3
- 4
- 5
Double Bottom
was formed on 07.05 at 17:35:33 (UTC+0)
signal strength 1 of 5
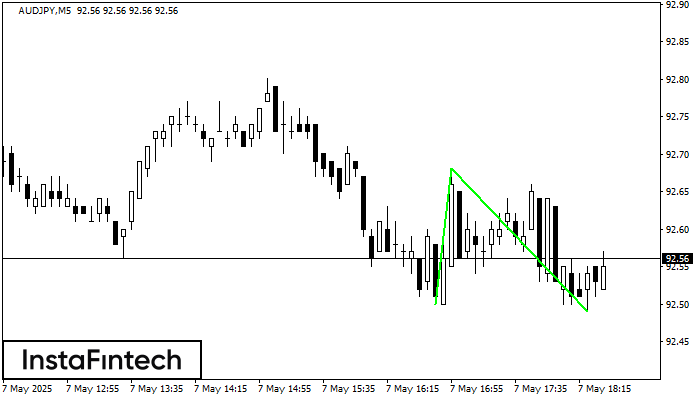
The Double Bottom pattern has been formed on AUDJPY M5. This formation signals a reversal of the trend from downwards to upwards. The signal is that a buy trade should
The M5 and M15 time frames may have more false entry points.
Open chart in a new window
Bullish Rectangle
was formed on 07.05 at 17:34:53 (UTC+0)
signal strength 3 of 5
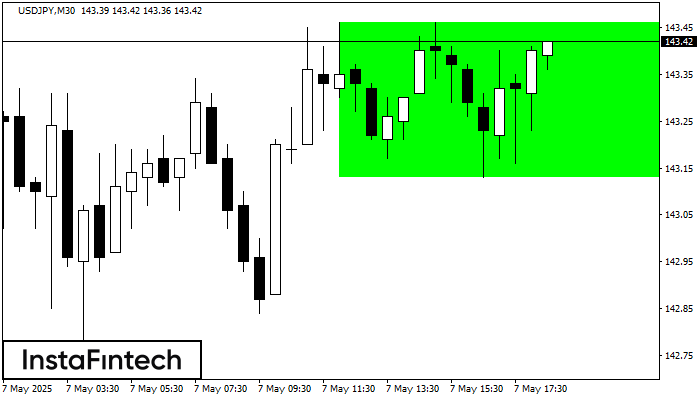
According to the chart of M30, USDJPY formed the Bullish Rectangle. The pattern indicates a trend continuation. The upper border is 143.46, the lower border is 143.13. The signal means
Open chart in a new window
Double Top
was formed on 07.05 at 17:29:59 (UTC+0)
signal strength 2 of 5
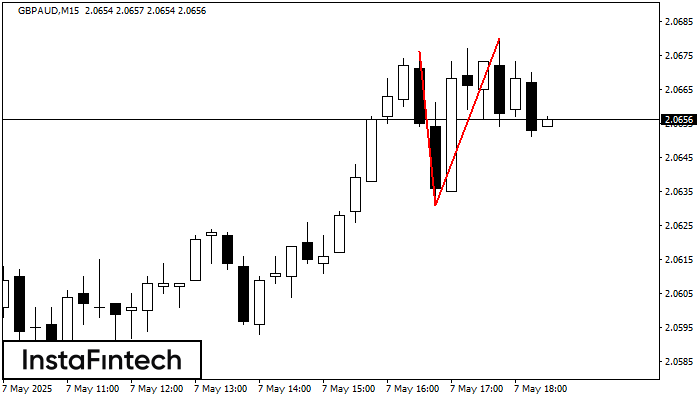
On the chart of GBPAUD M15 the Double Top reversal pattern has been formed. Characteristics: the upper boundary 2.0680; the lower boundary 2.0631; the width of the pattern 49 points
The M5 and M15 time frames may have more false entry points.
Open chart in a new window


