

Corak sebenar

Double Bottom
was formed on 03.04 at 03:15:07 (UTC+0)
signal strength 1 of 5
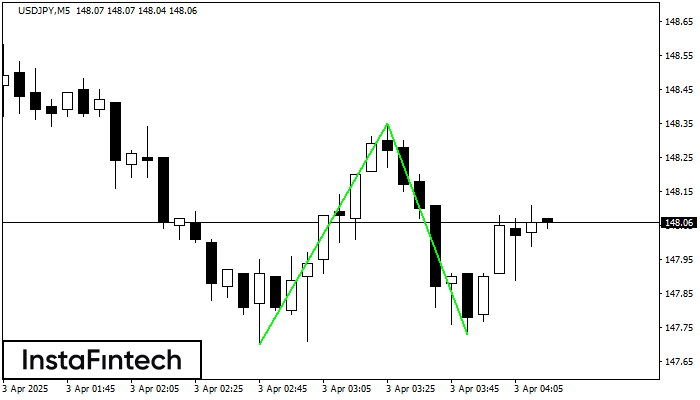
The Double Bottom pattern has been formed on USDJPY M5. This formation signals a reversal of the trend from downwards to upwards. The signal is that a buy trade should be opened after the upper boundary of the pattern 148.35 is broken. The further movements will rely on the width of the current pattern 65 points.
The M5 and M15 time frames may have more false entry points.
- All
- All
- Bearish Rectangle
- Bearish Symmetrical Triangle
- Bearish Symmetrical Triangle
- Bullish Rectangle
- Double Top
- Double Top
- Triple Bottom
- Triple Bottom
- Triple Top
- Triple Top
- All
- All
- Buy
- Sale
- All
- 1
- 2
- 3
- 4
- 5
Double Top
was formed on 23.04 at 03:35:42 (UTC+0)
signal strength 1 of 5
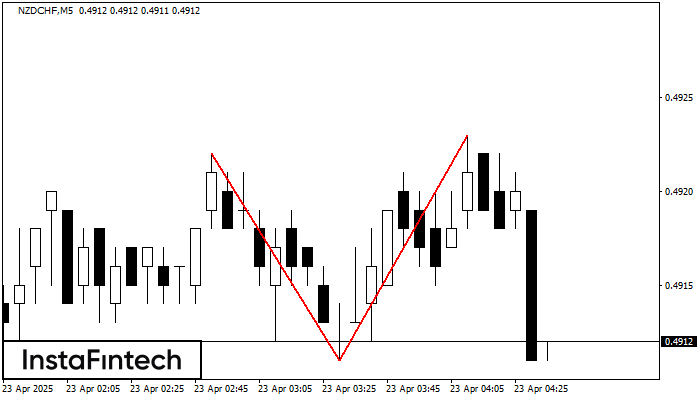
The Double Top reversal pattern has been formed on NZDCHF M5. Characteristics: the upper boundary 0.4922; the lower boundary 0.4911; the width of the pattern is 12 points. Sell trades
The M5 and M15 time frames may have more false entry points.
Open chart in a new window
Triple Top
was formed on 23.04 at 02:30:18 (UTC+0)
signal strength 1 of 5

The Triple Top pattern has formed on the chart of the #Bitcoin M5. Features of the pattern: borders have an ascending angle; the lower line of the pattern
The M5 and M15 time frames may have more false entry points.
Open chart in a new window
Triple Top
was formed on 23.04 at 02:15:05 (UTC+0)
signal strength 1 of 5

On the chart of the AUDJPY M5 trading instrument, the Triple Top pattern that signals a trend change has formed. It is possible that after formation of the third peak
The M5 and M15 time frames may have more false entry points.
Open chart in a new window

