

Corak sebenar

Inverse Head and Shoulder
was formed on 03.04 at 00:00:00 (UTC+0)
signal strength 4 of 5

According to the chart of H1, AUDUSD formed the Inverse Head and Shoulder pattern. The Head’s top is set at 0.6315 while the median line of the Neck is found at 0.6220/0.6291. The formation of the Inverse Head and Shoulder pattern evidently signals a reversal of the downward trend. In other words, in case the scenario comes true, the price of AUDUSD will go towards 0.6355
- All
- All
- Bearish Rectangle
- Bearish Symmetrical Triangle
- Bearish Symmetrical Triangle
- Bullish Rectangle
- Double Top
- Double Top
- Triple Bottom
- Triple Bottom
- Triple Top
- Triple Top
- All
- All
- Buy
- Sale
- All
- 1
- 2
- 3
- 4
- 5
Double Top
was formed on 08.05 at 17:30:26 (UTC+0)
signal strength 1 of 5
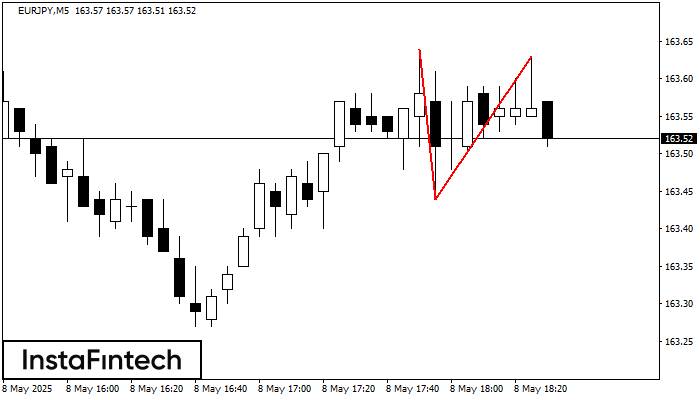
On the chart of EURJPY M5 the Double Top reversal pattern has been formed. Characteristics: the upper boundary 163.63; the lower boundary 163.44; the width of the pattern 19 points
The M5 and M15 time frames may have more false entry points.
Open chart in a new window
Bullish Rectangle
was formed on 08.05 at 17:13:01 (UTC+0)
signal strength 4 of 5
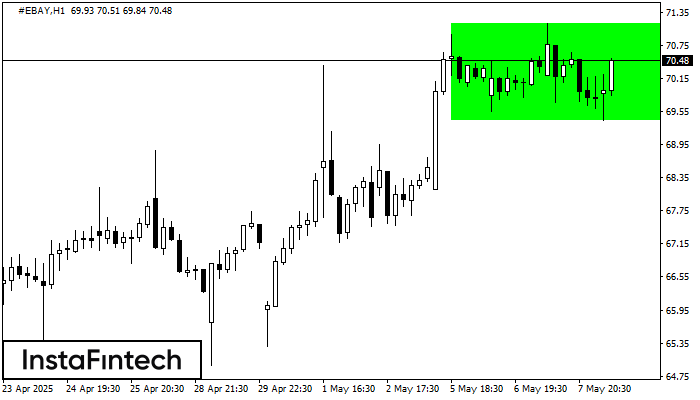
According to the chart of H1, #EBAY formed the Bullish Rectangle which is a pattern of a trend continuation. The pattern is contained within the following borders: the lower border
Open chart in a new window
Bullish Rectangle
was formed on 08.05 at 17:10:50 (UTC+0)
signal strength 3 of 5
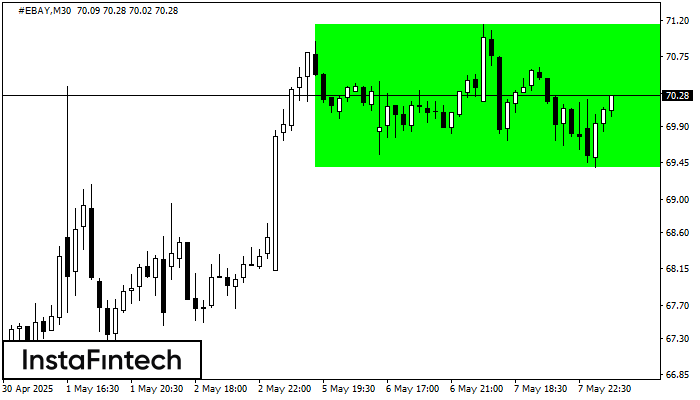
According to the chart of M30, #EBAY formed the Bullish Rectangle. The pattern indicates a trend continuation. The upper border is 71.15, the lower border is 69.39. The signal means
Open chart in a new window


