

Corak sebenar

Triple Top
was formed on 02.04 at 19:45:07 (UTC+0)
signal strength 2 of 5
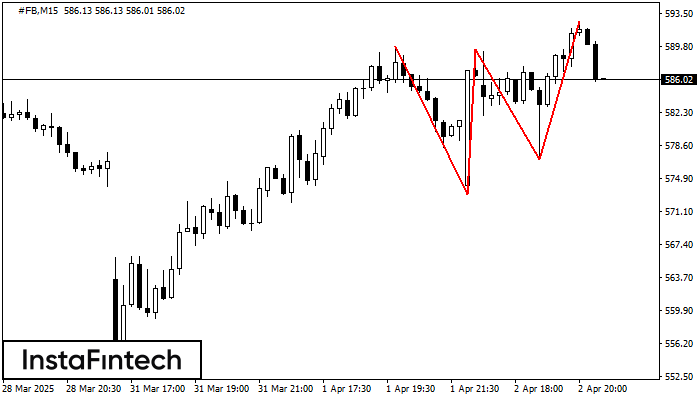
On the chart of the #FB M15 trading instrument, the Triple Top pattern that signals a trend change has formed. It is possible that after formation of the third peak, the price will try to break through the resistance level 573.08, where we advise to open a trading position for sale. Take profit is the projection of the pattern’s width, which is 1673 points.
The M5 and M15 time frames may have more false entry points.
Juga lihat
- All
- All
- Bearish Rectangle
- Bearish Symmetrical Triangle
- Bearish Symmetrical Triangle
- Bullish Rectangle
- Double Top
- Double Top
- Triple Bottom
- Triple Bottom
- Triple Top
- Triple Top
- All
- All
- Buy
- Sale
- All
- 1
- 2
- 3
- 4
- 5
Triple Bottom
was formed on 21.04 at 19:00:13 (UTC+0)
signal strength 1 of 5
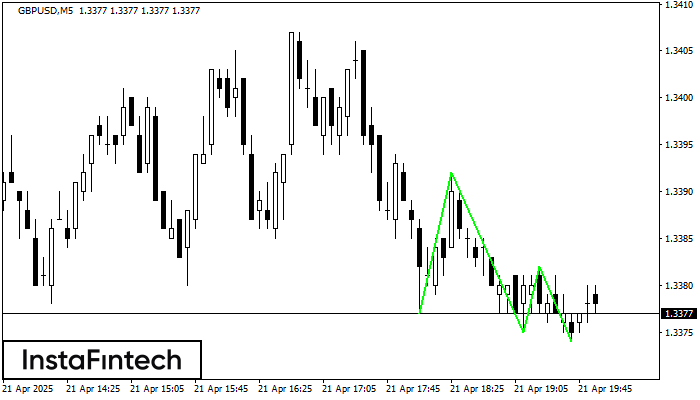
Corak Triple Bottom telah dibentuk pada GBPUSD M5. Ia mempunyai ciri-ciri berikut: tahap rintangan 1.3392/1.3382; tahap sokongan 1.3377/1.3374; lebar corak adalah 15 mata. Dalam situasi penembusan paras rintangan 1.3392, harga
Carta masa M5 dan M15 mungkin mempunyai lebih banyak titik kemasukan palsu.
Open chart in a new window
Triple Bottom
was formed on 21.04 at 18:40:14 (UTC+0)
signal strength 1 of 5

Corak Triple Bottom telah dibentuk pada carta bagi instrumen dagangan #AMZN M5. Corak menandakan perubahan aliran dari menurun ke aliran menaik dalam sekiranya penembusan 167.53/167.17
Carta masa M5 dan M15 mungkin mempunyai lebih banyak titik kemasukan palsu.
Open chart in a new window
Double Bottom
was formed on 21.04 at 18:15:42 (UTC+0)
signal strength 2 of 5
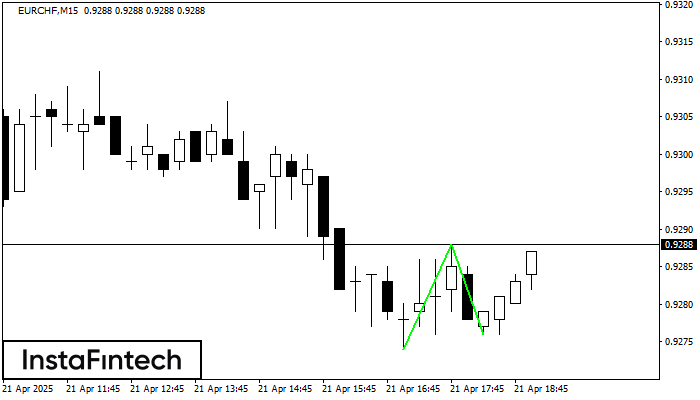
Corak Double Bottom telah dibentuk pada EURCHF M15. Pembentukan ini menandakan pembalikan aliran dari aliran menurun ke atas. Isyarat ialah perdagangan membeli harus dibuka selepas sempadan atas corak 0.9288 telah
Carta masa M5 dan M15 mungkin mempunyai lebih banyak titik kemasukan palsu.
Open chart in a new window


