

Corak sebenar

Double Bottom
was formed on 02.04 at 18:55:21 (UTC+0)
signal strength 1 of 5
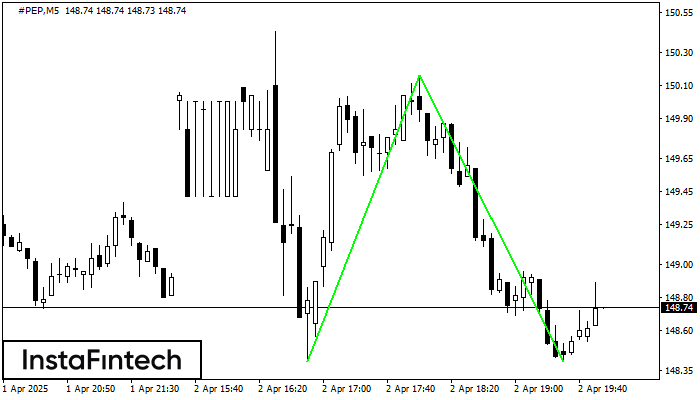
The Double Bottom pattern has been formed on #PEP M5; the upper boundary is 150.16; the lower boundary is 148.41. The width of the pattern is 175 points. In case of a break of the upper boundary 150.16, a change in the trend can be predicted where the width of the pattern will coincide with the distance to a possible take profit level.
The M5 and M15 time frames may have more false entry points.
Juga lihat
- All
- All
- Bearish Rectangle
- Bearish Symmetrical Triangle
- Bearish Symmetrical Triangle
- Bullish Rectangle
- Double Top
- Double Top
- Triple Bottom
- Triple Bottom
- Triple Top
- Triple Top
- All
- All
- Buy
- Sale
- All
- 1
- 2
- 3
- 4
- 5
Triple Top
was formed on 16.04 at 13:40:08 (UTC+0)
signal strength 1 of 5
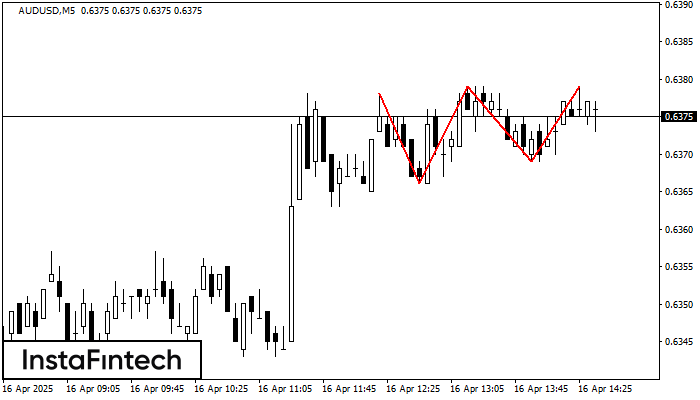
On the chart of the AUDUSD M5 trading instrument, the Triple Top pattern that signals a trend change has formed. It is possible that after formation of the third peak
The M5 and M15 time frames may have more false entry points.
Open chart in a new window
Triple Bottom
was formed on 16.04 at 13:30:30 (UTC+0)
signal strength 1 of 5
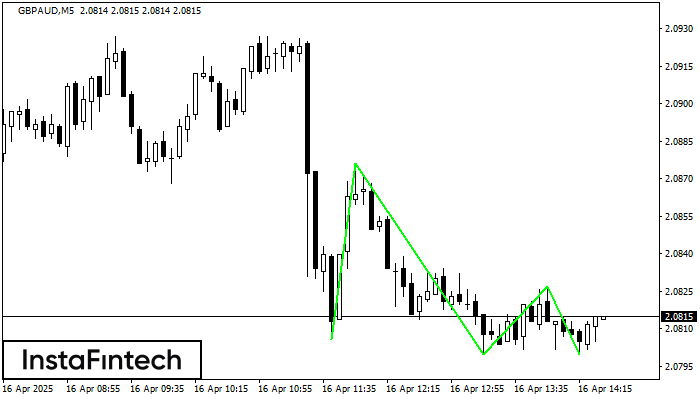
The Triple Bottom pattern has formed on the chart of the GBPAUD M5 trading instrument. The pattern signals a change in the trend from downwards to upwards in the case
The M5 and M15 time frames may have more false entry points.
Open chart in a new window
Bullish Symmetrical Triangle
was formed on 16.04 at 13:16:42 (UTC+0)
signal strength 1 of 5
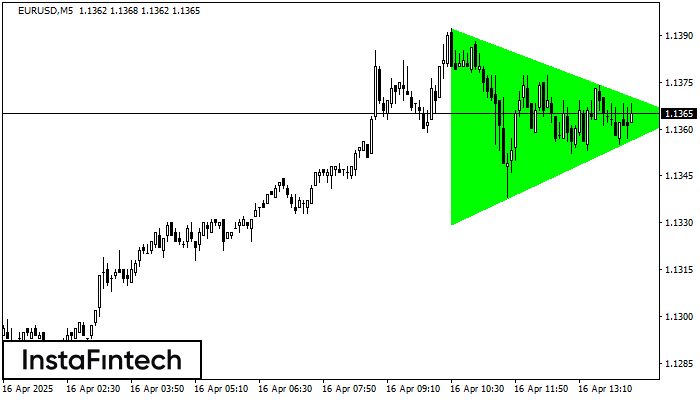
According to the chart of M5, EURUSD formed the Bullish Symmetrical Triangle pattern, which signals the trend will continue. Description. The upper border of the pattern touches the coordinates 1.1392/1.1364
The M5 and M15 time frames may have more false entry points.
Open chart in a new window


