

Corak sebenar

Double Bottom
was formed on 02.04 at 10:40:27 (UTC+0)
signal strength 1 of 5
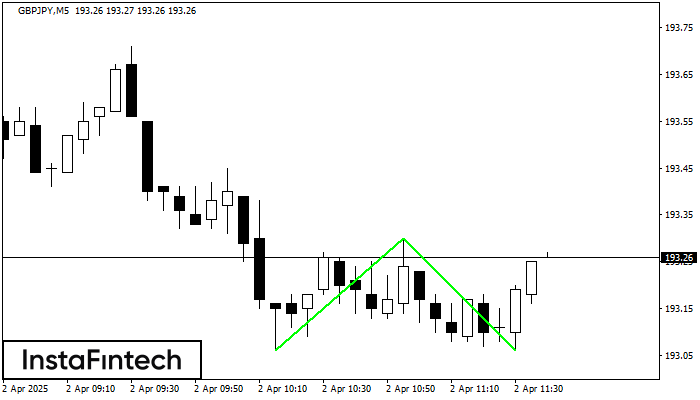
The Double Bottom pattern has been formed on GBPJPY M5; the upper boundary is 193.30; the lower boundary is 193.06. The width of the pattern is 24 points. In case of a break of the upper boundary 193.30, a change in the trend can be predicted where the width of the pattern will coincide with the distance to a possible take profit level.
The M5 and M15 time frames may have more false entry points.
Juga lihat
- All
- All
- Bearish Rectangle
- Bearish Symmetrical Triangle
- Bearish Symmetrical Triangle
- Bullish Rectangle
- Double Top
- Double Top
- Triple Bottom
- Triple Bottom
- Triple Top
- Triple Top
- All
- All
- Buy
- Sale
- All
- 1
- 2
- 3
- 4
- 5
Triple Top
was formed on 08.05 at 06:00:08 (UTC+0)
signal strength 1 of 5
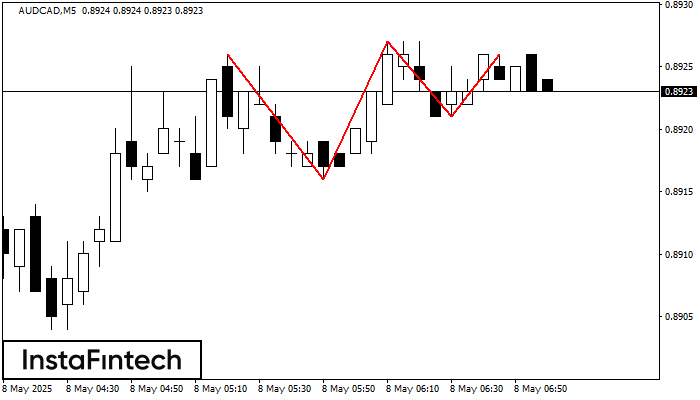
Corak Triple Top telah dibentuk pada carta AUDCAD M5. Ciri corak: sempadan mempunyai sudut menaik; garisan bawah corak mempunyai koordinat 0.8916/0.8921 dengan had atas 0.8926/0.8926; unjuran lebar ialah 10 mata
Carta masa M5 dan M15 mungkin mempunyai lebih banyak titik kemasukan palsu.
Open chart in a new window
Double Bottom
was formed on 08.05 at 03:00:09 (UTC+0)
signal strength 1 of 5
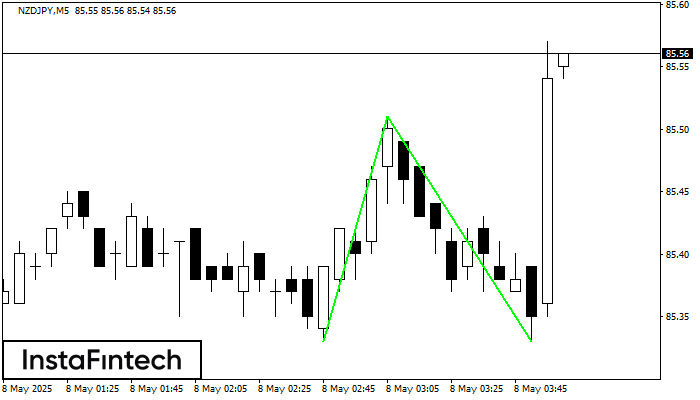
Corak Double Bottom telah dibentuk pada NZDJPY M5. Ciri-ciri: tahap sokongan 85.33; tahap rintangan 85.51; lebar corak 18 mata. Sekiranya tahap rintangan ditembusi, perubahan aliran boleh diramalkan dengan titik sasaran
Carta masa M5 dan M15 mungkin mempunyai lebih banyak titik kemasukan palsu.
Open chart in a new window
Double Top
was formed on 08.05 at 02:56:23 (UTC+0)
signal strength 1 of 5
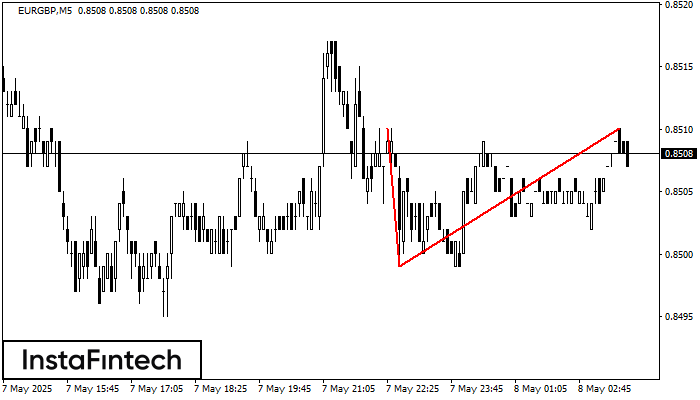
Corak Double Top telah dibentuk pada EURGBP M5. Isyarat bahawa aliran telah berubah dari aliran menaik ke aliran menurun. Mungkin, sekiranya asas corak 0.8499 ditembusi, pergerakan menurun akan berterusan
Carta masa M5 dan M15 mungkin mempunyai lebih banyak titik kemasukan palsu.
Open chart in a new window


