

Corak sebenar

Double Bottom
was formed on 02.04 at 10:15:42 (UTC+0)
signal strength 2 of 5
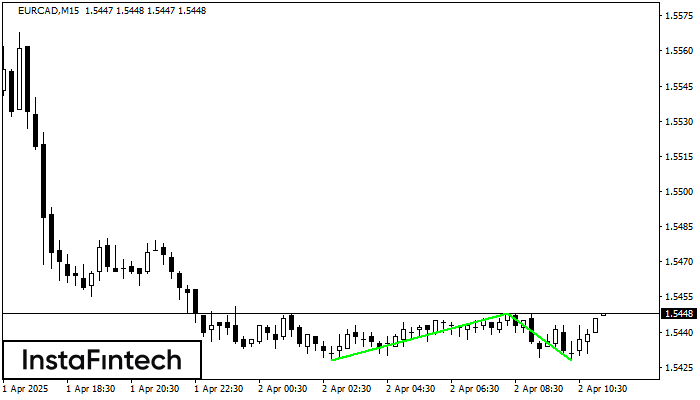
The Double Bottom pattern has been formed on EURCAD M15. This formation signals a reversal of the trend from downwards to upwards. The signal is that a buy trade should be opened after the upper boundary of the pattern 1.5448 is broken. The further movements will rely on the width of the current pattern 20 points.
The M5 and M15 time frames may have more false entry points.
- All
- All
- Bearish Rectangle
- Bearish Symmetrical Triangle
- Bearish Symmetrical Triangle
- Bullish Rectangle
- Double Top
- Double Top
- Triple Bottom
- Triple Bottom
- Triple Top
- Triple Top
- All
- All
- Buy
- Sale
- All
- 1
- 2
- 3
- 4
- 5
डबल बॉटम
was formed on 21.04 at 21:10:25 (UTC+0)
signal strength 1 of 5
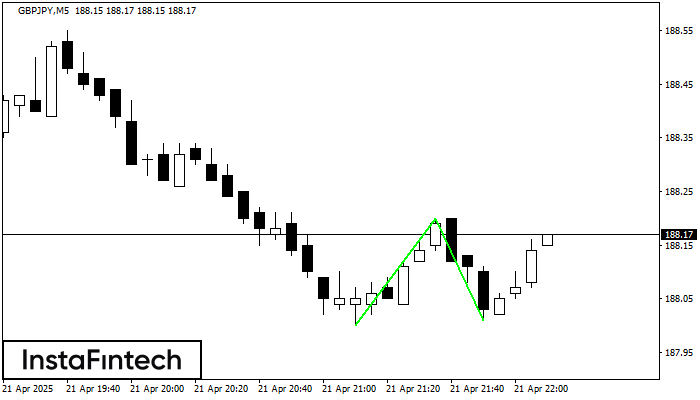
डबल बॉटम पैटर्न GBPJPY M5 पर बना है। विशेषताएं: समर्थन स्तर 188.00; प्रतिरोध स्तर 188.20; पैटर्न की चौड़ाई 20 पॉइंट्स। यदि प्रतिरोध स्तर टूट जाता है, तो रुझान में बदलाव
M5 और M15 समय सीमा में अधिक फाल्स एंट्री पॉइंट्स हो सकते हैं।
Open chart in a new window
डबल टॉप
was formed on 21.04 at 20:31:25 (UTC+0)
signal strength 1 of 5
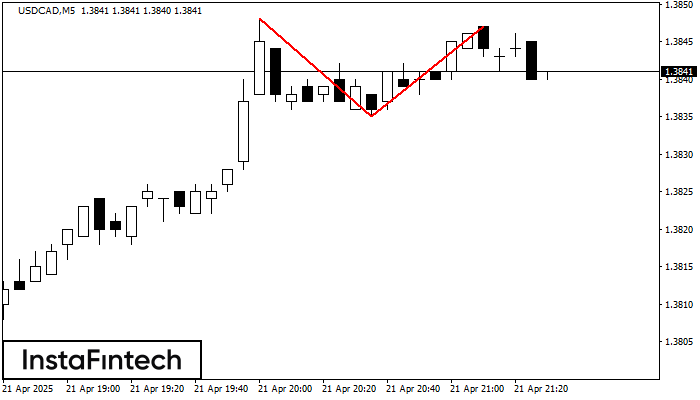
डबल टॉप पैटर्न USDCAD M5 पर बना है। यह संकेत देता है कि प्रवृत्ति ऊपर से नीचे की ओर बदल गई है। संभवतः, यदि 1.3835 पैटर्न का आधार टूट जाता
M5 और M15 समय सीमा में अधिक फाल्स एंट्री पॉइंट्स हो सकते हैं।
Open chart in a new window
डबल बॉटम
was formed on 21.04 at 20:30:22 (UTC+0)
signal strength 2 of 5
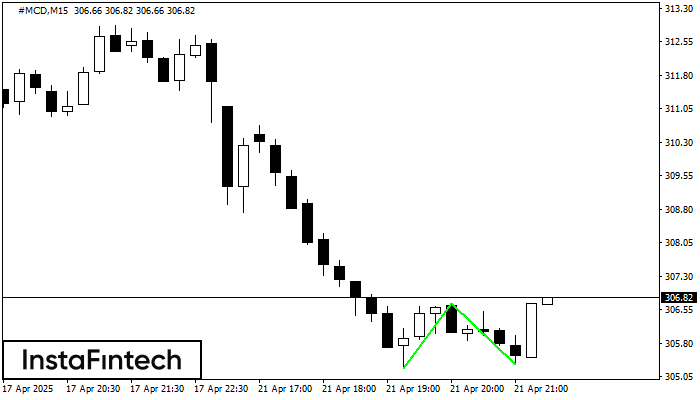
डबल बॉटम पैटर्न #MCD M15 पर बना है। विशेषताएं: समर्थन स्तर 305.24; प्रतिरोध स्तर 306.70; पैटर्न की चौड़ाई 146 पॉइंट्स। यदि प्रतिरोध स्तर टूट जाता है, तो रुझान में बदलाव
M5 और M15 समय सीमा में अधिक फाल्स एंट्री पॉइंट्स हो सकते हैं।
Open chart in a new window


