

Corak sebenar

Bullish Symmetrical Triangle
was formed on 01.04 at 18:50:43 (UTC+0)
signal strength 1 of 5
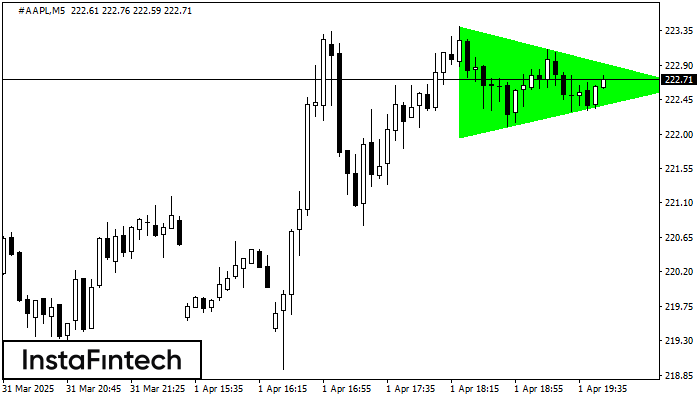
According to the chart of M5, #AAPL formed the Bullish Symmetrical Triangle pattern. The lower border of the pattern touches the coordinates 221.96/222.64 whereas the upper border goes across 223.40/222.64. If the Bullish Symmetrical Triangle pattern is in progress, this evidently signals a further upward trend. In other words, in case the scenario comes true, the price of #AAPL will breach the upper border to head for 222.79.
The M5 and M15 time frames may have more false entry points.
Juga lihat
- All
- All
- Bearish Rectangle
- Bearish Symmetrical Triangle
- Bearish Symmetrical Triangle
- Bullish Rectangle
- Double Top
- Double Top
- Triple Bottom
- Triple Bottom
- Triple Top
- Triple Top
- All
- All
- Buy
- Sale
- All
- 1
- 2
- 3
- 4
- 5
Double Top
was formed on 06.05 at 16:45:22 (UTC+0)
signal strength 1 of 5
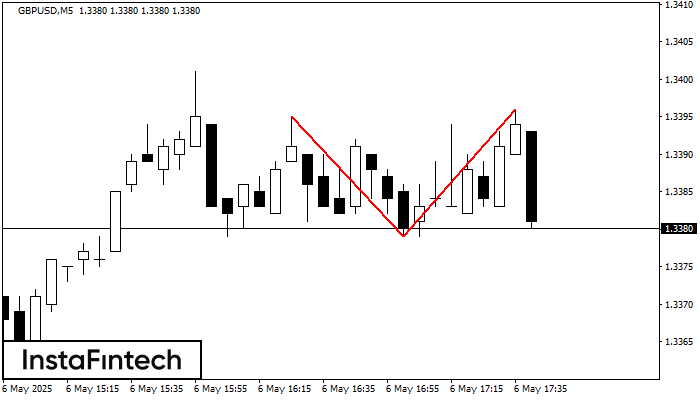
Corak pembalikan Double Top telah dibentuk pada GBPUSD M5. Ciri-ciri: sempadan atas %P0.000000; sempadan bawah 1.3395; sempadan bawah 1.3379; lebar corak adalah 17 mata. Dagangan menjual adalah lebih baik untuk
Carta masa M5 dan M15 mungkin mempunyai lebih banyak titik kemasukan palsu.
Open chart in a new window
Double Top
was formed on 06.05 at 16:30:12 (UTC+0)
signal strength 1 of 5
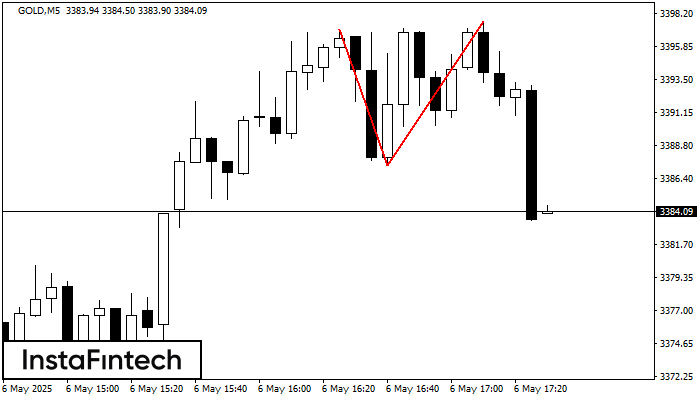
Corak pembalikan Double Top telah dibentuk pada GOLD M5. Ciri-ciri: sempadan atas %P0.000000; sempadan bawah 3397.08; sempadan bawah 3387.33; lebar corak adalah 1031 mata. Dagangan menjual adalah lebih baik untuk
Carta masa M5 dan M15 mungkin mempunyai lebih banyak titik kemasukan palsu.
Open chart in a new window
Inverse Head dan Shoulder
was formed on 06.05 at 16:00:15 (UTC+0)
signal strength 3 of 5
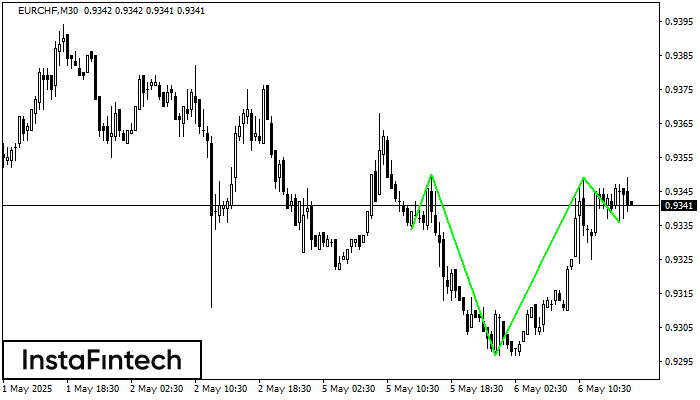
According to M30, EURCHF is shaping the technical pattern – the Inverse Head dan Shoulder. In case the Neckline 0.9350/0.9349 is broken out, the instrument is likely to move toward
Open chart in a new window


