

Corak sebenar

Triple Top
was formed on 01.04 at 00:15:38 (UTC+0)
signal strength 1 of 5
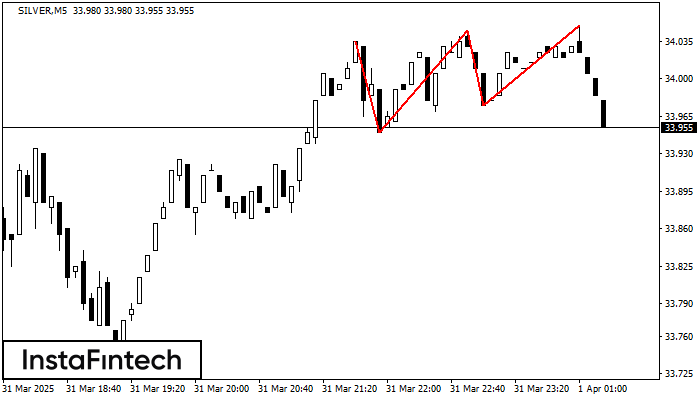
On the chart of the SILVER M5 trading instrument, the Triple Top pattern that signals a trend change has formed. It is possible that after formation of the third peak, the price will try to break through the resistance level 33.95, where we advise to open a trading position for sale. Take profit is the projection of the pattern’s width, which is 85 points.
The M5 and M15 time frames may have more false entry points.
Juga lihat
- All
- All
- Bearish Rectangle
- Bearish Symmetrical Triangle
- Bearish Symmetrical Triangle
- Bullish Rectangle
- Double Top
- Double Top
- Triple Bottom
- Triple Bottom
- Triple Top
- Triple Top
- All
- All
- Buy
- Sale
- All
- 1
- 2
- 3
- 4
- 5
Double Top
was formed on 05.05 at 22:25:24 (UTC+0)
signal strength 1 of 5
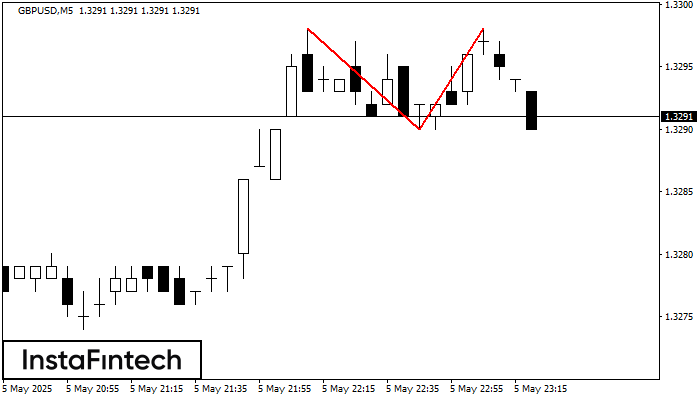
Corak pembalikan Double Top telah dibentuk pada GBPUSD M5. Ciri-ciri: sempadan atas %P0.000000; sempadan bawah 1.3298; sempadan bawah 1.3290; lebar corak adalah 8 mata. Dagangan menjual adalah lebih baik untuk
Carta masa M5 dan M15 mungkin mempunyai lebih banyak titik kemasukan palsu.
Open chart in a new window
Segi Tiga Simetri Menurun
was formed on 05.05 at 22:24:12 (UTC+0)
signal strength 1 of 5
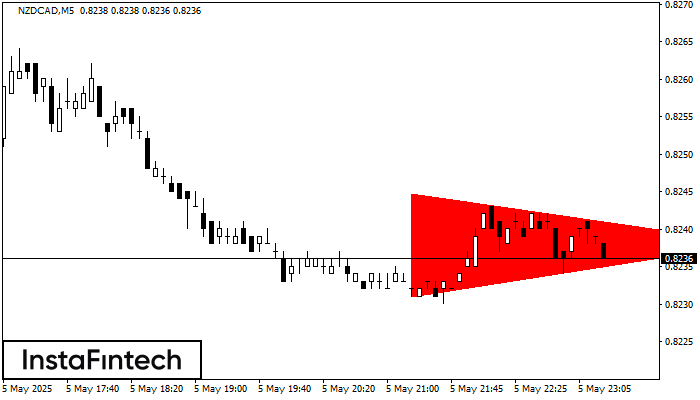
Berdasarkan carta M5, NZDCAD membentuk corak Segi Tiga Simetri Menurun. Corak ini menandakan aliran menurun lagi dalam situasi sempadan rendah 0.8231 ditembusi. Di sini, keuntungan andaian akan sepadan dengan lebar
Carta masa M5 dan M15 mungkin mempunyai lebih banyak titik kemasukan palsu.
Open chart in a new window
Triple Bottom
was formed on 05.05 at 21:40:10 (UTC+0)
signal strength 1 of 5
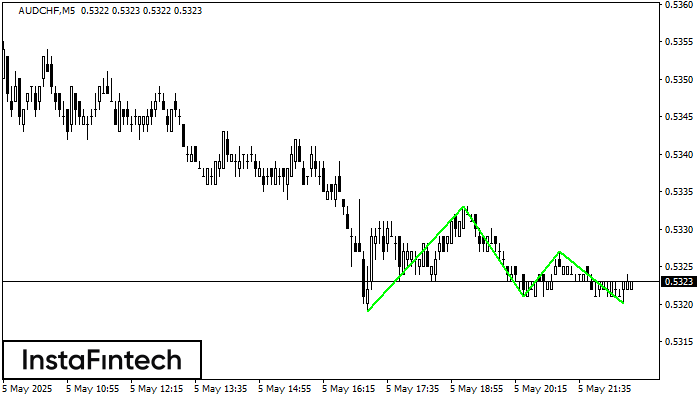
Corak Triple Bottom telah dibentuk pada carta AUDCHF M5. Ciri-ciri corak: Garisan bawah corak mempunyai koordinat 0.5333 dengan had atas 0.5333/0.5327, unjuran lebar adalah 14 mata. Pembentukan corak Triple Bottom
Carta masa M5 dan M15 mungkin mempunyai lebih banyak titik kemasukan palsu.
Open chart in a new window


