

Corak sebenar

Triple Bottom
was formed on 31.03 at 01:40:32 (UTC+0)
signal strength 1 of 5
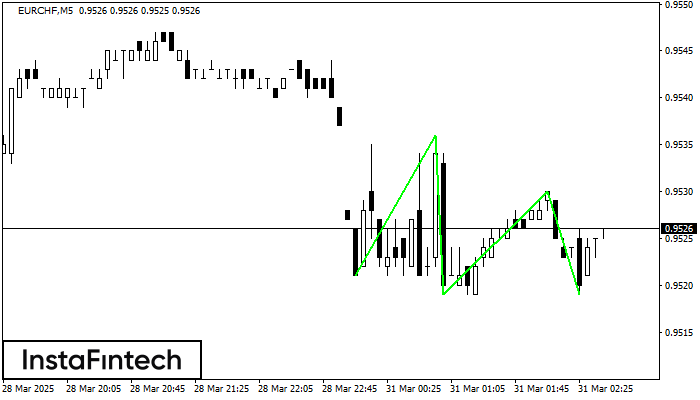
The Triple Bottom pattern has formed on the chart of EURCHF M5. Features of the pattern: The lower line of the pattern has coordinates 0.9536 with the upper limit 0.9536/0.9530, the projection of the width is 15 points. The formation of the Triple Bottom pattern most likely indicates a change in the trend from downward to upward. This means that in the event of a breakdown of the resistance level 0.9521, the price is most likely to continue the upward movement.
The M5 and M15 time frames may have more false entry points.
Juga lihat
- All
- All
- Bearish Rectangle
- Bearish Symmetrical Triangle
- Bearish Symmetrical Triangle
- Bullish Rectangle
- Double Top
- Double Top
- Triple Bottom
- Triple Bottom
- Triple Top
- Triple Top
- All
- All
- Buy
- Sale
- All
- 1
- 2
- 3
- 4
- 5
Double Top
was formed on 09.04 at 17:34:43 (UTC+0)
signal strength 1 of 5
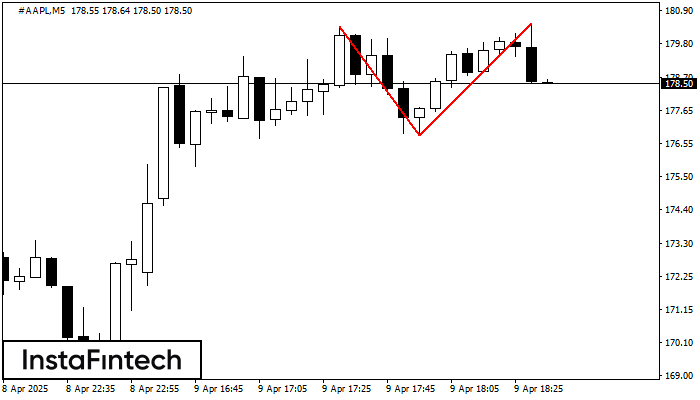
Corak Double Top telah dibentuk pada #AAPL M5. Isyarat bahawa aliran telah berubah dari aliran menaik ke aliran menurun. Mungkin, sekiranya asas corak 176.83 ditembusi, pergerakan menurun akan berterusan
Carta masa M5 dan M15 mungkin mempunyai lebih banyak titik kemasukan palsu.
Open chart in a new window
Double Bottom
was formed on 09.04 at 17:29:37 (UTC+0)
signal strength 2 of 5
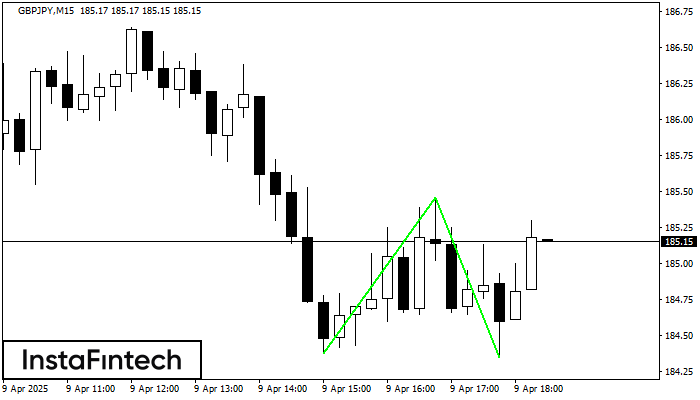
Corak Double Bottom telah dibentuk pada GBPJPY M15; sempadan atas adalah 185.46; sempadan bawah adalah 184.35. Lebar corak adalah 108 mata. Sekiranya penembusan sempadan atas 185.46, perubahan aliran boleh diramalkan
Carta masa M5 dan M15 mungkin mempunyai lebih banyak titik kemasukan palsu.
Open chart in a new window
Double Bottom
was formed on 09.04 at 17:19:56 (UTC+0)
signal strength 1 of 5
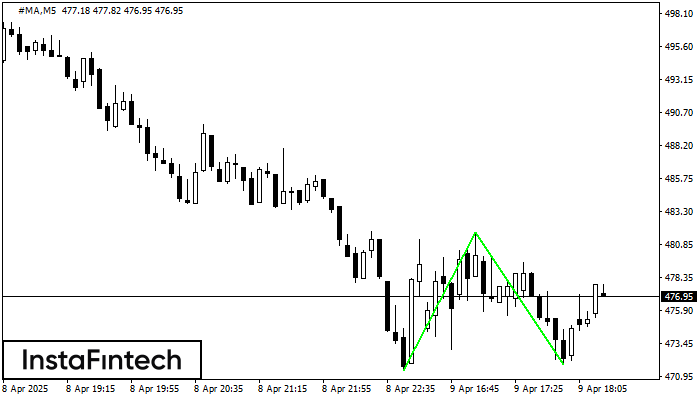
Corak Double Bottom telah dibentuk pada #MA M5. Ciri-ciri: tahap sokongan 471.47; tahap rintangan 481.71; lebar corak 1024 mata. Sekiranya tahap rintangan ditembusi, perubahan aliran boleh diramalkan dengan titik sasaran
Carta masa M5 dan M15 mungkin mempunyai lebih banyak titik kemasukan palsu.
Open chart in a new window


