

Corak sebenar

Double Bottom
was formed on 29.03 at 11:00:31 (UTC+0)
signal strength 3 of 5

The Double Bottom pattern has been formed on #Bitcoin M30. Characteristics: the support level 83552.05; the resistance level 84588.82; the width of the pattern 103677 points. If the resistance level is broken, a change in the trend can be predicted with the first target point lying at the distance of 96966 points.
Juga lihat
- All
- All
- Bearish Rectangle
- Bearish Symmetrical Triangle
- Bearish Symmetrical Triangle
- Bullish Rectangle
- Double Top
- Double Top
- Triple Bottom
- Triple Bottom
- Triple Top
- Triple Top
- All
- All
- Buy
- Sale
- All
- 1
- 2
- 3
- 4
- 5
Bullish Rectangle
was formed on 07.05 at 16:08:47 (UTC+0)
signal strength 2 of 5
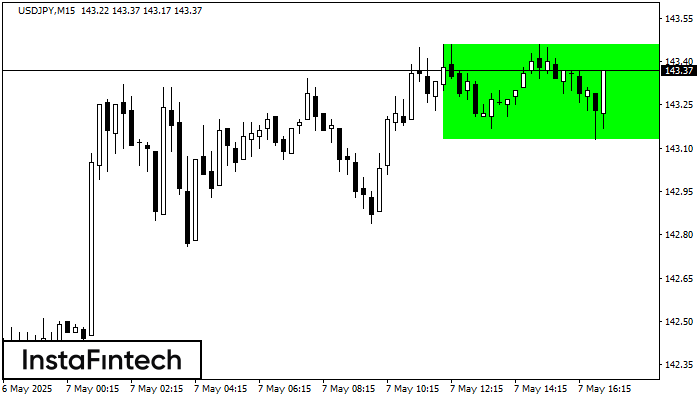
According to the chart of M15, USDJPY formed the Bullish Rectangle. This type of a pattern indicates a trend continuation. It consists of two levels: resistance 143.46 and support 143.13
The M5 and M15 time frames may have more false entry points.
Open chart in a new window
Bullish Rectangle
was formed on 07.05 at 16:01:30 (UTC+0)
signal strength 4 of 5
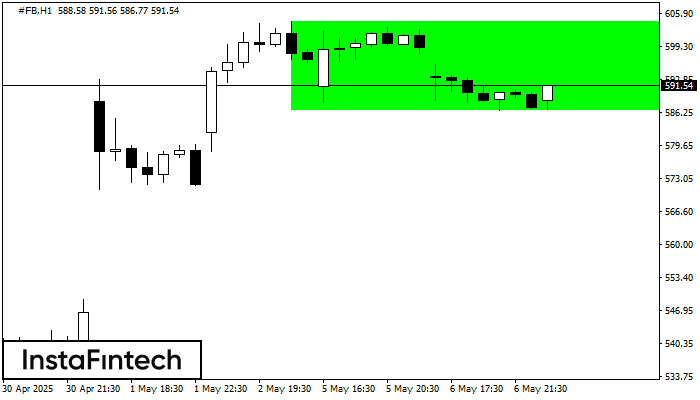
According to the chart of H1, #FB formed the Bullish Rectangle. The pattern indicates a trend continuation. The upper border is 604.25, the lower border is 586.62. The signal means
Open chart in a new window
Bullish pennant
was formed on 07.05 at 16:01:24 (UTC+0)
signal strength 2 of 5
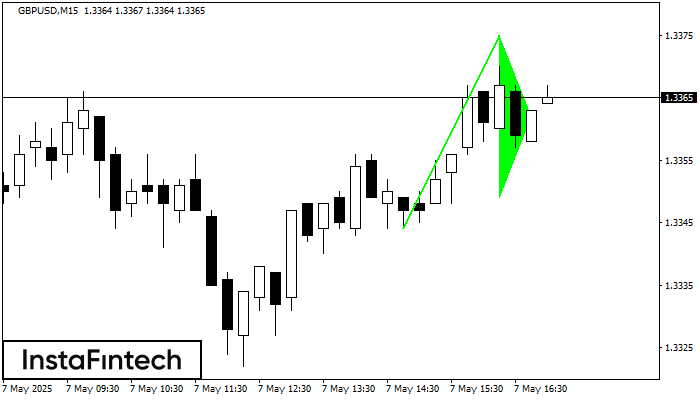
The Bullish pennant signal – Trading instrument GBPUSD M15, continuation pattern. Forecast: it is possible to set up a buy position above the pattern’s high of 1.3375, with the prospect
The M5 and M15 time frames may have more false entry points.
Open chart in a new window


