

Corak sebenar

Bearish Symmetrical Triangle
was formed on 28.03 at 21:30:39 (UTC+0)
signal strength 2 of 5
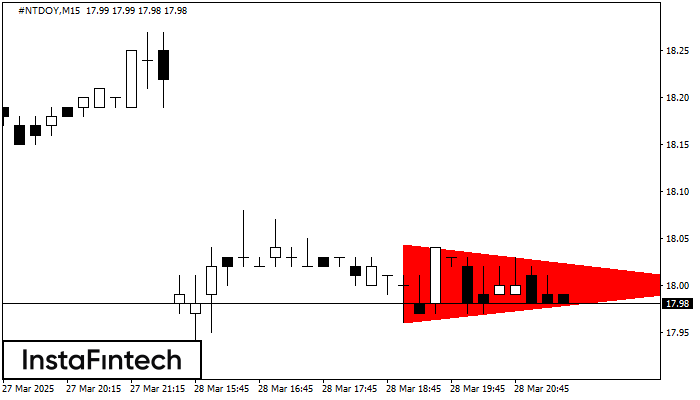
According to the chart of M15, #NTDOY formed the Bearish Symmetrical Triangle pattern. Description: The lower border is 17.96/18.00 and upper border is 18.04/18.00. The pattern width is measured on the chart at -8 pips. The formation of the Bearish Symmetrical Triangle pattern evidently signals a continuation of the downward trend. In other words, if the scenario comes true and #NTDOY breaches the lower border, the price could continue its move toward 17.77.
The M5 and M15 time frames may have more false entry points.
- All
- All
- Bearish Rectangle
- Bearish Symmetrical Triangle
- Bearish Symmetrical Triangle
- Bullish Rectangle
- Double Top
- Double Top
- Triple Bottom
- Triple Bottom
- Triple Top
- Triple Top
- All
- All
- Buy
- Sale
- All
- 1
- 2
- 3
- 4
- 5
Bullish Symmetrical Triangle
was formed on 05.05 at 05:57:59 (UTC+0)
signal strength 2 of 5
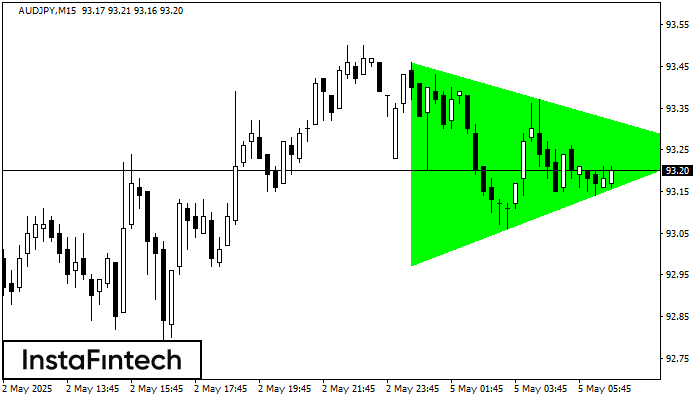
According to the chart of M15, AUDJPY formed the Bullish Symmetrical Triangle pattern. The lower border of the pattern touches the coordinates 92.97/93.25 whereas the upper border goes across 93.46/93.25
The M5 and M15 time frames may have more false entry points.
Open chart in a new window
Double Top
was formed on 05.05 at 05:10:19 (UTC+0)
signal strength 1 of 5

The Double Top pattern has been formed on NZDJPY M5. It signals that the trend has been changed from upwards to downwards. Probably, if the base of the pattern 86.15
The M5 and M15 time frames may have more false entry points.
Open chart in a new window
Double Top
was formed on 05.05 at 04:15:20 (UTC+0)
signal strength 1 of 5
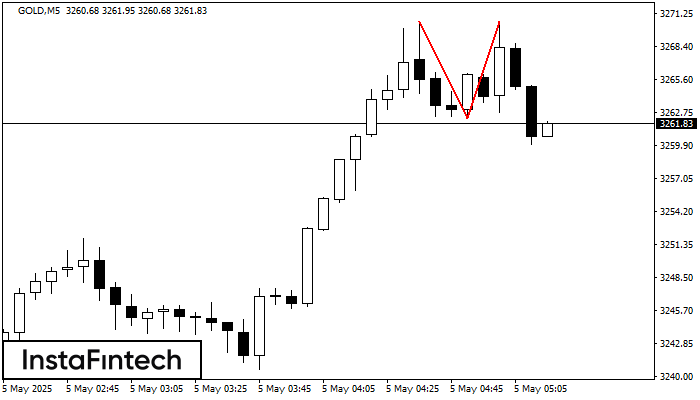
The Double Top pattern has been formed on GOLD M5. It signals that the trend has been changed from upwards to downwards. Probably, if the base of the pattern 3262.20
The M5 and M15 time frames may have more false entry points.
Open chart in a new window

