

Corak sebenar

Head and Shoulders
was formed on 27.03 at 10:10:13 (UTC+0)
signal strength 1 of 5

According to the chart of M5, GBPCHF formed the Head and Shoulders pattern. The Head’s top is set at 1.1418 while the median line of the Neck is found at 1.1408/1.1408. The formation of the Head and Shoulders pattern evidently signals a reversal of the upward trend. In other words, in case the scenario comes true, the price of GBPCHF will go towards 1.1393.
The M5 and M15 time frames may have more false entry points.
Juga lihat
- All
- All
- Bearish Rectangle
- Bearish Symmetrical Triangle
- Bearish Symmetrical Triangle
- Bullish Rectangle
- Double Top
- Double Top
- Triple Bottom
- Triple Bottom
- Triple Top
- Triple Top
- All
- All
- Buy
- Sale
- All
- 1
- 2
- 3
- 4
- 5
बियरिश सिमेट्रिकल त्रिभुज
was formed on 09.04 at 09:01:56 (UTC+0)
signal strength 2 of 5

M15 के चार्ट के अनुसार, NZDJPY से बियरिश सिमेट्रिकल त्रिभुज पैटर्न बना। विवरण: निचली सीमा 79.77/80.40 है और ऊपरी सीमा 81.02/80.40 है। पैटर्न की चौड़ाई चार्ट पर -125 पिप्स
M5 और M15 समय सीमा में अधिक फाल्स एंट्री पॉइंट्स हो सकते हैं।
Open chart in a new window
बुलिश फ्लैग
was formed on 09.04 at 08:53:25 (UTC+0)
signal strength 1 of 5
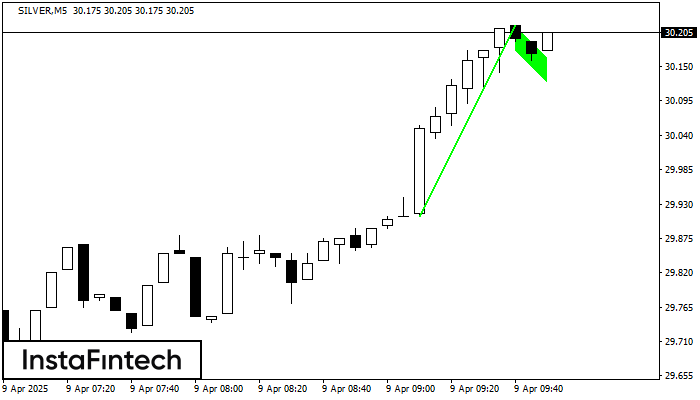
बुलिश फ्लैग पैटर्न SILVER M5 चार्ट पर बनाया गया है जो दर्शाता है कि ऊपर की ओर रुझान जारी रहेगा। संकेत: 30.21 पर शिखर के टूटने से कीमत अधिक हो
M5 और M15 समय सीमा में अधिक फाल्स एंट्री पॉइंट्स हो सकते हैं।
Open chart in a new window
बुलिश पताका
was formed on 09.04 at 08:53:20 (UTC+0)
signal strength 1 of 5
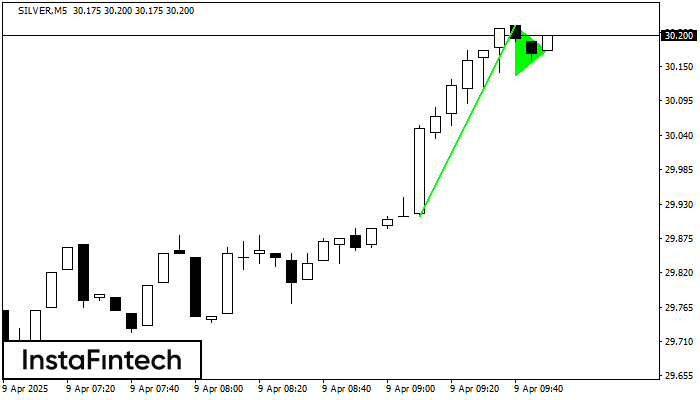
बुलिश पताका ग्राफ़िक पैटर्न SILVER M5 इंस्ट्रूमेंट पर बना है। यह निरंतरता पैटर्न की श्रेणी में आता है। इस मामले में, यदि भाव उच्च स्तर पर टूटता है, तो इसके
M5 और M15 समय सीमा में अधिक फाल्स एंट्री पॉइंट्स हो सकते हैं।
Open chart in a new window


